(U.S.) HR 61: Bill To Expand Scope Of Hate Crimes Introduced

Remember the mass shooting in Buffalo last year that was supposedly based on the “replacement theory”? It had been predicted that this would lead to more calls for gun control, and it did.

But the other shoe has dropped. House Resolution 61 has been introduced to expand hate crime laws within the U.S., and to specifically target a certain type of crime. It was sponsored by Congresswoman Sheila Jackson Lee, a Democrat from Texas.

What’s particularly alarming is how many of the terms in this Bill are not clearly defined. (See archive.) This makes it difficult to enforce, but enables it to be selectively applied. In a practical sense: it has the potential to make debate much trickier, and easier to shut down.

Yes, this is in the United States, but something similar could easily come to Canada in the not too distant future. Don’t dismiss the possibility.

To state the obvious: this is only focused on one group of people.

A BILL
To prevent and prosecute white supremacy inspired hate
crime and conspiracy to commit white supremacy in-
spired hate crime and to amend title 18, United States
Code, to expand the scope of hate crimes.

1 Be it enacted by the Senate and House of Representa-
2 tives of the United States of America in Congress assembled,
3 SECTION 1. SHORT TITLE.
4 This Act may be cited as the ‘‘Leading Against White
5 Supremacy Act of 2023’’.
6 SEC. 2. WHITE SUPREMACY INSPIRED HATE CRIME.
7 (a) IN GENERAL.—A person engages in a white su-
8 premacy inspired hate crime when white supremacy
ide

2
1 ology has motivated the planning, development, prepara-
2 tion, or perpetration of actions that constituted a crime
3 or were undertaken in furtherance of activity that, if effec-
4 tuated, would have constituted a crime.
5 (b) CONSPIRACY.—A conspiracy to engage in white
6 supremacy inspired hate crime shall be determined to
7 exist—

8 (1) between two or more persons engaged in the
9 planning, development, preparation, or perpetration
10 of a white supremacy inspired hate crime
; or
11 (2) between two or more persons—
12 (A) at least one of whom engaged in the
13 planning, development, preparation, or per-
14 petration of a white supremacy inspired hate
15 crime;
and
16 (B) at least one of whom published mate-
17 rial advancing white supremacy, white suprema-
18 cist ideology, antagonism based on ‘‘replace-
19 ment theory’’
, or hate speech that vilifies or is
20 otherwise directed against any non-White per-
21 son or group, and such published material—
22 (i) was published on a social media
23 platform or by other means of publication
24 with the likelihood that it would be viewed
25 by persons who are predisposed to engag-

3
•HR 61 IH
1 ing in any action in furtherance of a white
2 supremacy inspired hate crime, or who are
3 susceptible to being encouraged to engage
4 in actions in furtherance of a white su-
5 premacy inspired hate crime;
6 (ii) could, as determined by a reason-
7 able person, motivate actions by a person
8 predisposed to engaging in a white suprem-
9 acy inspired hate crime or by a person who
10 is susceptible to being encouraged to en-
11 gage in actions relating to a white suprem-
12 acy inspired hate crime
; and
13 (iii) was read, heard, or viewed by a
14 person who engaged in the planning, devel-
15 opment, preparation, or perpetration of a
16 white supremacy inspired hate crime.
17 (c) DEPARTMENT OF JUSTICE AUTHORITY, EN-
18 FORCEMENT, MONITORING, AND REPORTING.—The De-
19 partment shall have authority to conduct operations and
20 activities pursuant to this section, specifically—
21 (1) with regard to information or evidence ob-
22 tained by the Department of any action cited in this
23 section, the Department shall have the authority to
24 investigate, intercede, and undertake other actions
25 that it deems necessary and appropriate to interdict,

4
•HR 61 IH
1 mitigate, or prevent such action from culminating in
2 violent activity;
3 (2) the Department shall have the authority to
4 prosecute persons who engaged in actions cited in
5 this section
; and
6 (3) the Uniform Crime Reporting Program in
7 the Department of Justice shall maintain records of
8 white supremacy inspired hate crimes and related
9 actions cited in this section
, and enforcement actions
10 in response thereto.
11 The Department shall provide annual reports to the ap-
12 propriate committees in Congress that shall include infor-
13 mation cited in this paragraph.
14 SEC. 3. CRIMINAL OFFENSE.
15 Section 249(a)(1) of title 18, United States Code, is
16 amended—
17 (1) in the matter preceding subparagraph (A)
18 by inserting after ‘‘race, color, religion, or national
19 origin of any person’’ the following: ‘‘, or because of
20 a white supremacy based motivation against any
21 person’’
; and
22 (2) in subparagraph (B)—
23 (A) in clause (i), by striking ‘‘or’’ at the
24 end;

5
•HR 61 IH
1 (B) in clause (ii), by striking the period
2 and inserting ‘‘; or’’; and
3 (C) by adding at the end the following:
4 ‘‘(iii) the offense was in furtherance of
5 a white supremacy based motivation.’’.
6 SEC. 4. FINDINGS.
7 Section 4702 of the Matthew Shepard and James
8 Byrd Jr. Hate Crimes Prevention Act (18 U.S.C. 249
9 note) is amended by adding at the end the following:
10 ‘‘(11) Mass shootings and other hate crimes
11 motivated by white supremacy
have been increasing
12 in frequency and intensity. These heinous and viru-
13 lent crimes are inspired by conspiracy theories, bla-
14 tant bigotry, and mythical falsehoods such as ‘‘re-
15 placement theory’’
. All instances must be prevented
16 and severe criminal penalties must be applied to
17 their perpetrators.’’.

There is a section in HR 61 that states: Department of Justice shall maintain records of white supremacy inspired hate crimes and related actions cited in this section. Does this mean that groups that talk about the ongoing replacement in the West will be looked at? (As if they aren’t already).

Also, will law enforcement to more than simply monitor and keep records? Will there be active involvement in setting up undercover operations or honeypots?

The Bill also talks about postings on the internet which people who are “susceptible to being encouraged” might read or view the content. This is another slippery slope. It seems designed to force authors to water down whatever they say because of what some random person “might” say or do.

Census data — Government distributed — in countries across the West have shown considerable demographic changes (or replacement, depending on your slant) over the last 60 or so years. Was it racist to have generated this information in the first place? Is it racist to openly and honestly discuss what is happening?

Moreover, the mainstream media has addressed this topic many times in the last few decades. It’s openly predicted that most countries in the West will be majority non-white by the end of this century, if not sooner. This is hardly a secret.

Hate crimes are already illegal in the U.S. So, why is this specific Bill necessary?

To play devil’s advocate here: this could simply be about grandstanding. It wouldn’t be the first time a politician put forth legislation they never planned to advance in order to score points. Then again, it may not be the case.

The vague and undefined definitions and explanations are possibly the worst part, as there are no actual standards to be applied.

(1) https://www.congress.gov/118/bills/hr61/BILLS-118hr61ih.pdf
(2) BILLS 118 House Resolution 61
(3) https://www.congress.gov/member/sheila-jackson-lee/J000032
(4) https://www.npr.org/2022/05/16/1099034094/what-is-the-great-replacement-theory
(5) https://www.businessinsider.com/buffalo-mass-shooting-latest-linked-to-great-replacement-theory-2022-5?op=1

At Least 14,572 Illegal Entries Into Canada July – October 2022

Things are picking up again, particularly in Quebec. The data for the later on in 2022 (July – October) shows that another 14,572 people illegally entered Canada, and that’s just what’s on the books. It should surprise no one that Roxham Road remains the most popular point of entry. We still don’t have the numbers for November and December yet, but they’ll push the 2022 total towards 40,000

For reference, these are just the number of interceptions that happened BETWEEN official border ports. It says nothing of the system itself being otherwise gamed. That has been covered elsewhere.

And what has 2022 brought us?

YEAR: 2022
MONTH QUEBEC MANITOBA B.C. OTHERS TOTAL
January 2,367 0 16 0 2,383
February 2,154 1 9 0 2,164
March 2,492 2 8 0 2,502
April 2,791 3 8 3 2,805
May 3,449 3 40 1 3,493
June 3,066 3 14 3 3,086
July 3,645 3 29 0 3,677
August 3,234 5 10 0 3,249
September 3,650 10 0 0 3,660
October 3,901 16 34 0 3,951
TOTALS 30,747 45 203 7 31,003

The numbers of people entering Canada illegally is rising again, after dropping in 2020 and 2021. Over 7,000 people were intercepted by the RCMP in the first 3 months of 2022. Another 9,400 came in the next 3 months. Of course, this is just what’s on the books, and just what’s publicly available.

Of all the things the authorities should be cracking down on….

Of course, this problem has been going on for a very long time. Here are some earlier years, to show the trends. There was a significant drop (although not a complete stop) during this “pandemic” psy-op. Makes sense, as flaunting the open borders would have been too obvious.

This is an issue that could be solved very quickly. But no major party has any intention of doing anything about it.

PROVINCE/TERRITORY 2011 2012 2013 2014 2015 2016
Newfoundland 0 0 0 0 0 0
Prince Edward Island 0 0 0 0 0 0
Nova Scotia 0 0 0 0 0 0
New Brunswick 10 5 5 ? ? 25
Quebec 1,335 1,295 785 875 1,035 2,595
Ontario 2,660 2,340 1,995 2,630 2,790 3,7935
Manitoba 20 15 25 10 225 505
Saskatchewan ? ? ? ? ? 30
Alberta 35 40 35 65 70 120
British Columbia 125 85 110 130 170 220
Yukon 0 0 0 0 0 5
Northwest Territories 0 0 0 0 0 0
Nunavut 0 0 0 0 0 0
TOTALS 4,185 3,770 2,955 3,715 4,290 7,365

Illegals were still coming into Canada via land border crossings during the Harper years. Interestingly though, it only receives major attention when Liberals are in power. A cynic may wonder why.

YEAR: 2017
MONTH QUEBEC MANITOBA B.C. OTHERS TOTAL
January 245 19 46 5 315
February 452 142 84 0 678
March 654 170 71 2 897
April 672 146 32 9 859
May 576 106 60 0 742
June 781 63 39 1 884
July 2,996 87 51 0 3,314
August 5,530 80 102 0 5,712
September 1,720 78 79 4 1,881
October 1,755 67 68 8 1,890
November 1,539 38 46 0 1,623
December 1,916 22 40 0 1,978
TOTAL 18,836 1,018 718 22 20,593
YEAR: 2018
MONTH QUEBEC MANITOBA B.C. OTHERS TOTAL
January 1,458 18 41 0 1,517
February 1,486 31 48 0 1,565
March 1,884 53 33 0 1,970
April 2,479 50 31 0 2,560
May 1,775 36 53 0 1,869
June 1,179 31 53 0 1,263
July 1,552 51 31 0 1,634
August 1,666 39 39 3 1,747
September 1,485 44 68 4 1,601
October 1,334 23 37 0 1,394
November 978 23 18 0 1,019
December 1,242 11 27 0 1,280
TOTAL 18,518 410 479 7 19,419
YEAR: 2019
MONTH QUEBEC MANITOBA B.C. OTHERS TOTAL
January 871 1 16 1 888
February 800 1 6 2 808
March 967 13 22 0 1,002
April 1,206 15 25 0 1,246
May 1,149 27 20 0 1,196
June 1,536 26 5 0 1,567
July 1,835 23 15 1 1,874
August 1,712 26 22 2 1,762
September 1,706 19 17 0 1,737
October 1,595 18 8 1 1,622
November 1,118 9 21 0 1,148
December 1,646 2 5 2 1,653
TOTAL 16,136 180 182 9 16,503
YEAR: 2020
MONTH QUEBEC MANITOBA B.C. OTHERS TOTAL
January 1,086 7 7 0 1,100
February 976 2 2 0 980
March 930 7 18 0 955
April 1 0 5 0 6
May 17 0 4 0 21
June 28 1 3 1 33
July 29 2 17 0 48
August 15 3 0 0 18
September 30 4 7 0 41
October 27 0 4 0 31
November 24 0 8 0 32
December 26 2 8 0 36
TOTAL 3,189 28 84 1 3,302
YEAR: 2021
MONTH QUEBEC MANITOBA B.C. OTHERS TOTAL
January 28 1 10 0 39
February 39 0 1 0 40
March 29 5 2 0 36
April 29 2 2 0 33
May 12 3 13 0 28
June 11 0 6 0 17
July 28 5 6 0 39
August 63 2 11 0 76
September 150 0 19 0 169
October 96 0 17 0 113
November 832 1 12 0 845
December 2,778 0 33 0 2,811
TOTAL 4,095 19 132 0 4,246

Of course, none of this addresses the absurdly high levels of legal migration that happens annually in Canada. That’s been the subject of many articles.

And here are some other things to consider:

In 2019, something happened that wasn’t really reported on. It was that the Canadian Government scrapped the DCO, or Designated Country of Origin policy. This stopped people from 42 countries (mainly in Europe) from being able to abuse the refugee system with bogus claims.

The Parties agree to review this Agreement and its implementation. The first review shall take place not later than 12 months from the date of entry into force and shall be jointly conducted by representatives of each Party. The Parties shall invite the UNHCR to participate in this review. The Parties shall cooperate with UNHCR in the monitoring of this Agreement and seek input from non-governmental organizations.

As for the Safe 3rd Country Agreement, people are still allowed to enter, and it’s still being gamed by human smugglers and traffickers. Few people know this, but the Treaty is actually a 3-way arrangement with the UNHCR acting as a sort of facilitator.

The U.N. High Commission on Refugees is a party to the Canada/U.S. border, at least as far as asylum claims are concerned. If both countries are considered “safe”, then why is this kind of shopping allowed?

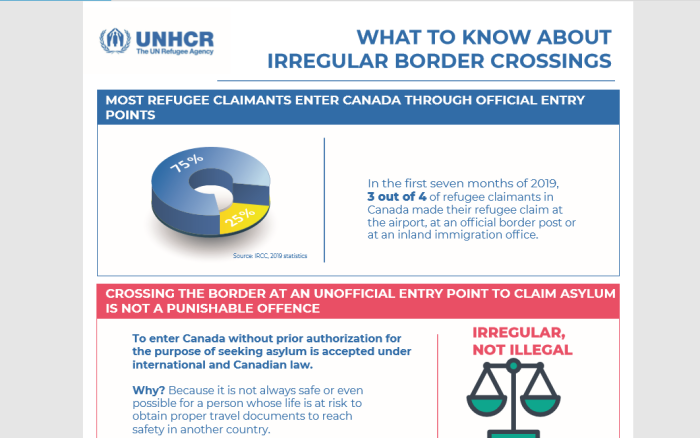
Not only is the United Nations a party to U.S/Canada border security, but the organization distributes information packages on how to circumvent the Safe Third Country Agreement. While claiming to care about the integrity of countries, they publish materials to do exactly the opposite.

And no, this isn’t just well meaning naivety. The U.N. has extensively studied the connection between lack of border enforcement, and the facilitation of human smuggling and trafficking. It isn’t a surprise that open borders lead to increases in illegal crossings. They know exactly what’s going on.

If that doesn’t make your blood boil, what will?

In all fairness, the issue of illegal crossings into Canada isn’t nearly as bad as the United States. And that’s a topic that needs far more extensive coverage. Even so, the problems on this border still, it’s an issue that does need to be reported on. More statistics in Canada are coming later.

(1) https://www.cbc.ca/news/canada/montreal/roxham-road-reopen-1.6257868
(2) https://www.canada.ca/en/immigration-refugees-citizenship/services/refugees/asylum-claims/processed-claims.html
(3) https://www.canada.ca/en/immigration-refugees-citizenship/services/refugees/asylum-claims/asylum-claims-2017.html
(4) https://www.canada.ca/en/immigration-refugees-citizenship/services/refugees/asylum-claims/asylum-claims-2018.html
(5) https://www.canada.ca/en/immigration-refugees-citizenship/services/refugees/asylum-claims/asylum-claims-2019.html
(6) https://www.canada.ca/en/immigration-refugees-citizenship/services/refugees/asylum-claims/asylum-claims-2020.html
(7) https://www.canada.ca/en/immigration-refugees-citizenship/services/refugees/asylum-claims/asylum-claims-2021.html
(8) https://www.canada.ca/en/immigration-refugees-citizenship/services/refugees/asylum-claims/asylum-claims-2022.html
(9) https://www.canada.ca/en/immigration-refugees-citizenship/news/2019/05/canada-ends-the-designated-country-of-origin-practice.html
(10) https://www.canada.ca/en/immigration-refugees-citizenship/corporate/mandate/policies-operational-instructions-agreements/agreements/safe-third-country-agreement/final-text.html
(11) https://canucklaw.ca/tsce-10c-bit-of-history-doug-rob-ford-voted-in-2013-for-sanctuary-toronto-amnesty-for-illegals/

Quarantine Act V.S. Int’l Convention Against The Taking Of Hostages

An argument that doesn’t seem to be brought up (at least in Canadian circles) is lockdown measures are illegal for another reason: they violate the International Convention Against the Taking of Hostages. Now, there is a provision that makes this (largely) null and void, but it’s still interesting to think about.

Of course, this doesn’t seem to apply when the state is the one taking the hostages. There’s a weasel clause that makes state-sanctioned hostage taking okay. One would think that international bodies facilitating hostage taking would make it apply.

Anyhow, let’s take a brief look through the document:

Article 1
Any person who seizes or detains and threatens to kill, to injure or to continue to detain another person (hereinafter referred to as the “hostage”) in order to compel a third party, namely, a State, an international intergovernmental organization, a natural or juridical person, or a group of persons, to do or abstain from doing any act as an explicit or implicit condition for the release of the hostage commits the offence of taking of hostages (“hostage-taking”) within the meaning of this Convention.
Any person who:
(a) attempts to commit an act of hostage-taking, or
(b) participates as an accomplice of anyone who commits or attempts to commit an act of hostage-taking likewise commits an offence for the purposes of this Convention.

One would think that detaining citizens at airports for refusing the nasal rape test (for a non-existent virus) counts. Does threatening people with financially crippling fines for not complying with arbitrary or inconsistent rules qualify?

What about forcibly sending people to quarantine camps? Or imposing de-facto house arrest for a period of time, as demanded by public health?

How about being threatened with the loss of one’s livelihood for not wanting to take an unknown experimental concoction?

Article 3
(1) The State Party in the territory of which the hostage is held by the offender shall take all measures it considers appropriate to ease the situation of the hostage, in particular, to secure his release and, after his release, to facilitate, when relevant, his departure.
(2) If any object which the offender has obtained as a result of the taking of hostages comes into the custody of a State Party, that State Party shall return it as soon as possible to the hostage or the third party referred to in article 1, as the case may be, or to the appropriate authorities thereof.

A country has an obligation under this agreement to secure the release of foreigners held hostage in another one. However, that doesn’t apply to domestic hostages.

Article 4
States Parties shall co-operate in the prevention of the offences set forth in article 1, particularly by:
.
(a) taking all practicable measures to prevent preparations in their respective territories for the commission of those offences within or outside their ter­ritories, including measures to prohibit in their territories illegal activities of persons, groups and organizations that encourage, instigate, organize or engage in the perpetration of acts of taking of hostages;
(b) exchanging information and coordinating the taking of administrative and other measures as appropriate to prevent the commission of those offences.

Based on this alone, the Public Health Agency of Canada should be shut down. It encourages, instigates, organizes and engages in acts of hostage taking via “public health orders”.

Article 7
The State Party where the alleged offender is prosecuted shall in accordance with its laws communicate the final outcome of the proceedings to the Secretary-General of the United Nations, who shall transmit the information to the other States con­cerned and the international intergovernmental organizations concerned.

Article 8
(1) The State Party in the territory of which the alleged offender is found shall, if it does not extradite him, be obliged, without exception whatsoever and whether or not the offence was committed in its territory, to submit the case to its competent authorities for the purpose of prosecution, through proceedings in accordance with the laws of that State. Those authorities shall take their decision in the same manner as in the case of any ordinary offence of a grave nature under the law of that State.
(2) Any person regarding whom proceedings are being carried out in connexion with any of the offences set forth in article 1 shall be guaranteed fair treatment at all stages of the proceedings, including enjoyment of all the rights and guarantees provided by the law of the State in the territory of which he is present.

Considering that these measures are instigated by supra-national bodies, would we not be able to extradite members of W.H.O. here in order to prosecute for hostage taking?

Article 13
This Convention shall not apply where the offence is committed within a single State, the hostage and the alleged offender are nationals of that State and the alleged offender is found in the territory of that State.

The U.N. states that “everyone has the right to life, liberty and secu­rity of person, as set out in the Universal Declaration of Human Rights and the In­ternational Covenant on Civil and Political Rights”, but this only seems to apply across borders. Abusing rights domestically doesn’t qualify.

In other words, a foreigner in Canada — even illegally — would theoretically have some recourse here. However, a Canadian citizen would not.

Article 14
Nothing in this Convention shall be construed as justifying the violation of the territorial integrity or political independence of a State in contravention of the Charter of the United Nations.

Logically, a country wouldn’t be able to carry out hostage taking under the guise of political independence. But when it’s the U.N. or W.H.O. behind it, then perhaps the rules don’t matter. That being said, look at Article 13, at how that loophole makes the document worthless.

Of course, the Quarantine Act is really just domestic implementation of the W.H.O.’s International Health Regulations, PHAC is just a branch of WHO, and originally Health Canada was meant for population control measures.

In the end, we have foreign bodies writing laws which effectively hold us hostage. There’s a treaty against taking hostages, but it doesn’t apply if done domestically. And this loophole bypasses punishment by having Federal, Provincial, and some Municipal authorities do their bidding.

(1) https://www.treaty-accord.gc.ca/
(2) https://www.treaty-accord.gc.ca/text-texte.aspx?lcid=1033&id=104001&t=637936622752983920
(3) https://www.unodc.org/documents/treaties/Special/1979%20International%20Convention%20against%20the%20Taking%20of%20Hostages.pdf

Replacement Migration In Canada: 1966 To 1979 Data

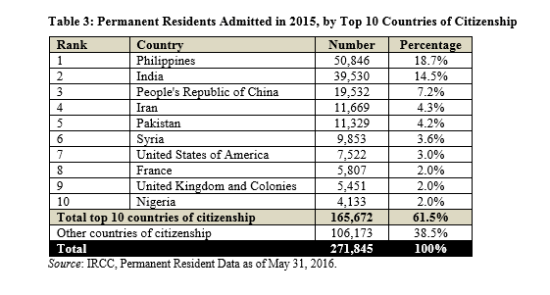
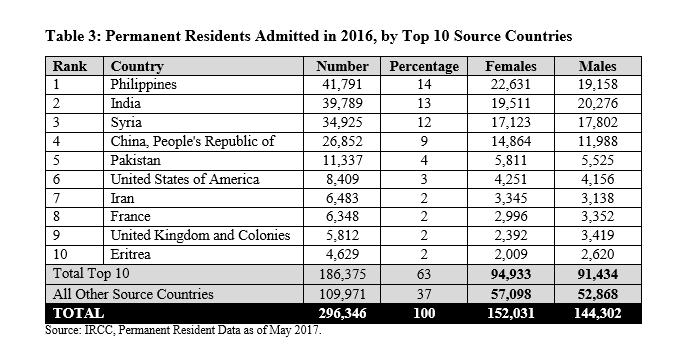
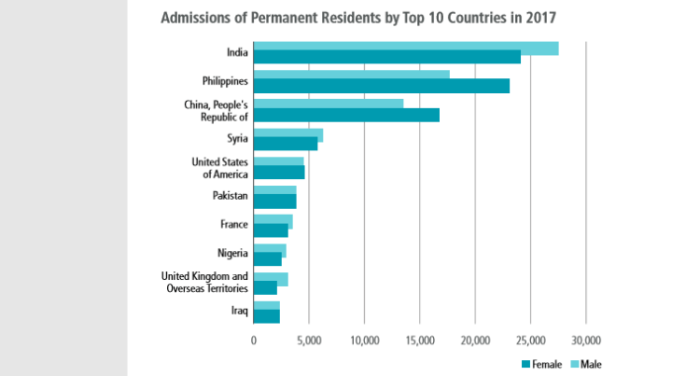
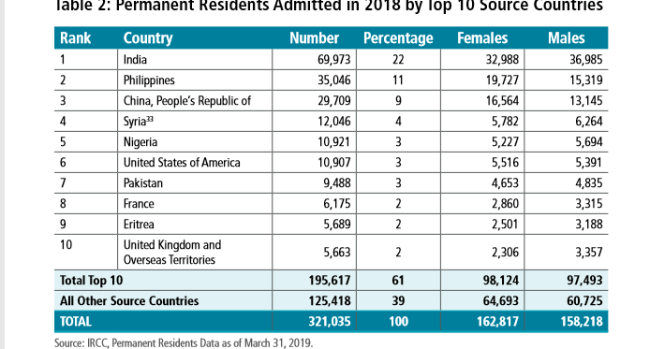
Here’s some data going back to the 1960s. These years feature quite differently than more recent reports. The United States and United Kingdom were consistently at the top of the source countries list. That has since been replaced by China, India and the Philippines. White genocide (a.k.a “replacement”) is a very real thing.

According to the United Nations, enacting policies designed to bring about the destruction of an ethnic, racial, or religious group (in all or in part), is considered genocide. Consequently, forced multiculturalism and population replacement should be viewed through that lens.

1. Mass LEGAL Immigration In Canada

Despite what many think, LEGAL immigration into Canada is actually a much larger threat than illegal aliens, given the true scale of the replacement that is happening. What was founded as a European (British) colony is becoming unrecognizable due to forced demographic changes. There are also social, economic, environmental and voting changes to consider. See this Canadian series, and the UN programs for more detail. Politicians, the media, and so-called “experts” have no interest in coming clean on this.

CLICK HERE, for UN Genocide Prevention/Punishment Convention.
CLICK HERE, for Barcelona Declaration & Kalergi Plan.
CLICK HERE, for UN Kalergi Plan (population replacement).
CLICK HERE, for UN replacement efforts since 1974.
CLICK HERE, for tracing steps of UN replacement agenda.

Note: If there are errors in calculating the totals, please speak up. Information is of no use to the public if it isn’t accurate.

2. Source Countries From 1966 To 1979

Let’s look at the “official” numbers from 1966 to 1979. The U.S. and U.K. are still featured prominently, something that will change in the coming years.

PERMANENT RESIDENTS IN YEAR 1966
SOURCE COUNTRY NUMBER PERCENTAGE RANK
United Kingdom 63,291 32.5 1
Italy 31,625 16.2 2
United States 17,514 9.0 3
Germany 9,263 4.8 4
Portugal 7,930 4.0 5
France 7,872 4.0 6
Greece 7,174 3.7 7
China 4,094 2.1 8
West Indies 3,935 2.0 9
Netherlands 3,794 1.9 10
TOTAL — TOP 10 156,492 80.4
TOTAL — OTHERS 38,251 19.6
GRAND TOTAL 194,743 100
PERMANENT RESIDENTS IN YEAR 1967
SOURCE COUNTRY NUMBER PERCENTAGE RANK
United Kingdom 62,420 28.0 1
Italy 30,055 13.4 2
United States 19,038 8.6 3
Germany 11,779 5.3 4
Greece 10,650 4.6 5
France 10,122 4.5 6
Portugal 9,500 4.2 7
West Indies 8,403 3.8 8
China 6,409 2.9 9
Australia 4,967 2.2 10
TOTAL — TOP 10 173,343 77.8
TOTAL — OTHERS 49,533 22.2
GRAND TOTAL 222,876 100
PERMANENT RESIDENTS IN YEAR 1968
SOURCE COUNTRY NUMBER PERCENTAGE RANK
United Kingdom 37,889 20.6 1
United States 20,422 11.1 2
Italy 19,774 10.8 3
Germany 8,966 4.8 4
China 8,382 4.6 5
France 8,184 4.4 6
Austria 8,125 4.4 7
Greece 7,739 4.2 8
Portugal 7,738 4.2 9
West Indies 7,563 4.1 10
TOTAL — TOP 10 104,782 57.0
TOTAL — OTHERS 79,192 43.0
GRAND TOTAL 183,974 100
PERMANENT RESIDENTS IN YEAR 1969
SOURCE COUNTRY NUMBER PERCENTAGE RANK
United Kingdom 31,977 19.8 1
United States 22,785 14.1 2
West Indies 13,093 8.1 3
Italy 10,383 6.4 4
China 8,272 5.1 5
Portugal 7,182 4.4 6
Greece 6,937 4.3 7
Germany 5,880 3.6 8
France 5,549 3.4 9
India 5,395 3.3 10
TOTAL — TOP 10 117,453 72.7
TOTAL — OTHERS 44,078 27.3
GRAND TOTAL 161,531 100
PERMANENT RESIDENTS IN YEAR 1970
SOURCE COUNTRY NUMBER PERCENTAGE RANK
United Kingdom 26,497 18.7 1
United States 24,424 16.5 2
West Indies 12,456 8.4 3
Italy 8,533 5.8 4
Portugal 7,902 5.4 5
Greece 6,327 4.3 6
Yugoslavia 5,672 3.8 7
India 5,670 3.8 8
China 5,377 3.6 9
France 4,410 2.9 10
TOTAL — TOP 10 101,596 68.8
TOTAL — OTHERS 46,118 31.2
GRAND TOTAL 147,714 100
PERMANENT RESIDENTS IN YEAR 1971
SOURCE COUNTRY NUMBER PERCENTAGE RANK
United States 24,366 20.0 1
United Kingdom 15,451 12.8 2
Portugal 9,157 7.5 3
Italy 5,790 4.8 4
India 5,313 4.4 5
China 5,009 4.1 6
Greece 4,769 3.9 7
Philippines 4,180 3.4 8
Yugoslavia 2,997 2.4 9
France 2,966 2.4 10
TOTAL — TOP 10 79,998 66.6
TOTAL — OTHERS 41,902 34.4
GRAND TOTAL 121,900 100
PERMANENT RESIDENTS IN YEAR 1972
SOURCE COUNTRY NUMBER PERCENTAGE RANK
United States 22,618 18.5 1
United Kingdom 18,197 14.9 2
Portugal 8,737 7.2 3
Hong Kong 6,297 5.2 4
India 5,049 4.1 5
Uganda 5,021 4.1 6
Italy 4,608 3.8 7
Greece 4,016 3.3 8
Philippines 3,946 3.2 9
France 2,742 2.2 10
TOTAL — TOP 10 81,231 66.6
TOTAL — OTHERS 40,775 33.4
GRAND TOTAL 122,006 100
PERMANENT RESIDENTS IN YEAR 1973
SOURCE COUNTRY NUMBER PERCENTAGE RANK
United Kingdom 26,973 14.6 1
United States 25,242 13.7 2
Hong Kong 14,662 8.0 3
Portugal 13,483 7.3 4
Jamaica 9,363 5.1 5
India 9,203 5.0 6
Philippines 6,757 3.7 7
Greece 5,833 3.2 8
Italy 5,468 3.0 9
Trinidad-Tobago 5,138 2.8 10
TOTAL — TOP 10 122,122 66.3
TOTAL — OTHERS 62,078 33.7
GRAND TOTAL 184,200 100
PERMANENT RESIDENTS IN YEAR 1974
SOURCE COUNTRY NUMBER PERCENTAGE RANK
United Kingdom 38,456 17.6 1
United States 26,541 12.1 2
Portugal 16,333 7.5 3
India 12,868 5.9 4
Hong Kong 12,704 5.8 5
Jamaica 11,286 5.2 6
Philippines 9,564 4.4 7
Greece 5,632 2.6 8
Italy 5,226 2.4 9
Haiti 4,857 2.2 10
TOTAL — TOP 10 143,467 65.7
TOTAL — OTHERS 74,998 34.3
GRAND TOTAL 218,465 100
PERMANENT RESIDENTS IN YEAR 1975
SOURCE COUNTRY NUMBER PERCENTAGE RANK
United Kingdom 34,978 18.6 1
United States 20,155 10.7 2
Hong Kong 11,132 5.9 3
India 10,144 5.4 4
Portugal 8,390 4.5 5
Jamaica 8,211 4.4 6
Philippines 7,364 3.9 7
Italy 5,078 2.7 8
Guyana 4,394 2.3 9
South Korea 4,314 2.3 10
TOTAL — TOP 10 114,163 60.8
TOTAL — OTHERS 73,718 39.2
GRAND TOTAL 187,881 100
PERMANENT RESIDENTS IN YEAR 1976
SOURCE COUNTRY NUMBER PERCENTAGE RANK
United Kingdom 21,548 14.4 1
United States 17,315 11.6 2
Hong Kong 10,725 7.2 3
Jamaica 7,282 4.9 4
Lebanon 7,161 4.8 5
India 6,733 4.5 6
Philippines 5,939 4.0 7
Portugal 5,344 3.6 8
Italy 4,530 3.0 9
Guyana 3,430 2.3 10
TOTAL — TOP 10 90,007 60.2
TOTAL — OTHERS 59,422 39.8
GRAND TOTAL 149,429 100
PERMANENT RESIDENTS IN YEAR 1977
SOURCE COUNTRY NUMBER PERCENTAGE RANK
United Kingdom 17,977 15.6 1
United States 12,888 11.2 3
Hong Kong 6,371 5.5 3
Philippines 6,232 5.4 4
India 5,555 4.8 5
Lebanon 3,847 3.3 6
Portugal 3,579 3.1 7
Italy 3,411 3.0 8
France 2,757 2.4 9
Guyana 2,472 2.4 10
TOTAL — TOP 10 65,089 56.7
TOTAL — OTHERS 49,825 43.3
GRAND TOTAL 114,914 100
PERMANENT RESIDENTS IN YEAR 1978
SOURCE COUNTRY NUMBER PERCENTAGE RANK
United Kingdom 11,801 13.7 1
United States 9,945 11.5 2
India 5,110 5.9 3
Hong Kong 4,740 5.5 4
Philippines 4,370 5.1 5
Portugal 3,086 3.6 6
Italy 2,976 .43 7
France 1,754 2.9 8
South Africa 1,653 1.9 9
Lebanon 1,454 1.7 10
TOTAL — TOP 10 46,880 54.3
TOTAL — OTHERS 39,424 45.7
GRAND TOTAL 86,313 100
PERMANENT RESIDENTS IN YEAR 1979
SOURCE COUNTRY NUMBER PERCENTAGE RANK
Vietnam 19,859 17.7 1
United Kingdom 12,853 11.5 2
United States 9,617 8.6 3
Hong Kong 5,966 5.3 4
India 4,517 4.0 5
Laos 3,903 3.5 6
Philippines 3,873 3.5 7
Jamaica 3,213 2.9 8
Guyana 2,473 2.2 9
China 2,058 2.1 10
TOTAL — TOP 10 68,332 61.0
TOTAL — OTHERS 43,764 39.0
GRAND TOTAL 112,096 100

Permanent Residents: U.S., Europe and Australia as a percentage of overall migration globally. The vast majority of people getting PR in recent years aren’t from those areas.

YEAR # U.S. % U.S. # Eur. % Eur. # Aust % Austr # Other % Other
1973 25,242 13.7 71,883 39.0 2,096 1.1 84,979 46.1
1974 26,541 12.1 88,694 40.6 2,022 0.1 102,208 46.3
1975 20,155 10.7 72,898 38.8 1,654 0.1 87,174 46.4
1976 17,315 11.5 49,908 33.3 1,387 0.1 80,819 54.1
1977 12,888 11.2 40,747 35.5 1,063 0.1 60,216 52.4
1978 9,945 11.5 30,075 34.8 1,233 1.4 45,060 52.2
1979 9,617 8.6 32,858 29.3 808 0.1 68,813 61.4

3. More Recent Statistics On Immigration Source Countries

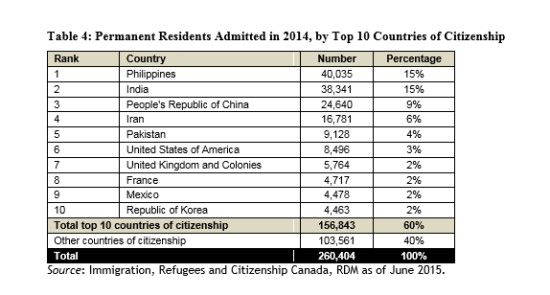
The above may not seem too bad, but keep in mind that the trends are about to get a whole lot worse. Here are numbers from within the last decade. Of course, this doesn’t include the hordes of students and “temporary” workers who come and don’t leave.

(Page 16 of the 2015 Annual Report to Parliament)

(Page 10 of the 2016 Annual Report to Parliament)

(Page 14 of the 2017 Annual Report to Parliament)

(Page 28 of the 2018 Annual Report to Parliament)

(Page 36 of the 2019 Annual Report to Parliament)

Notice any major changes? The U.K. and U.S. are nowhere near as prominent as they once were, and the demographic replacement is accelerating.

Of course, this doesn’t address the levels of student visas and “temporary” workers, which would increase drastically in the coming years.

4. Documents Provided By Canadian Government

(A.0) https://epe.lac-bac.gc.ca/100/202/301/immigration_statistics-ef/index.html
(A.1) https://epe.lac-bac.gc.ca/100/202/301/immigration_statistics-ef/mp22-1_1966.pdf
Canada Immigration Statistics 1966
(A.2) https://epe.lac-bac.gc.ca/100/202/301/immigration_statistics-ef/mp22-1_1967.pdf
Canada Immigration Statistics 1967
(A.3) https://epe.lac-bac.gc.ca/100/202/301/immigration_statistics-ef/mp22-1_1968.pdf
Canada Immigration Statistics 1968
(A.4) https://epe.lac-bac.gc.ca/100/202/301/immigration_statistics-ef/mp22-1_1969.pdf
Canada Immigration Statistics 1969
(A.5) https://epe.lac-bac.gc.ca/100/202/301/immigration_statistics-ef/mp22-1_1970.pdf
Canada Immigration Statistics 1970
(A.6) https://epe.lac-bac.gc.ca/100/202/301/immigration_statistics-ef/mp22-1_1971.pdf
Canada Immigration Statistics 1971
(A.7) https://epe.lac-bac.gc.ca/100/202/301/immigration_statistics-ef/mp22-1_1972.pdf
Canada Immigration Statistics 1972
(A.8) https://epe.lac-bac.gc.ca/100/202/301/immigration_statistics-ef/mp22-1_1973.pdf
Canada Immigration Statistics 1973
(A.9) https://epe.lac-bac.gc.ca/100/202/301/immigration_statistics-ef/mp22-1_1974.pdf
Canada Immigration Statistics 1974
(A.10) https://epe.lac-bac.gc.ca/100/202/301/immigration_statistics-ef/mp22-1_1975.pdf
Canada Immigration Statistics 1975
(A.11) https://epe.lac-bac.gc.ca/100/202/301/immigration_statistics-ef/mp22-1_1976.pdf
Canada Immigration Statistics 1976
(A.12) https://epe.lac-bac.gc.ca/100/202/301/immigration_statistics-ef/mp22-1_1977.pdf
Canada Immigration Statistics 1977
(A.13) https://epe.lac-bac.gc.ca/100/202/301/immigration_statistics-ef/mp22-1_1978.pdf
Canada Immigration Statistics 1978
(A.14) https://epe.lac-bac.gc.ca/100/202/301/immigration_statistics-ef/mp22-1_1979.pdf
Canada Immigration Statistics 1979
(A.15) https://epe.lac-bac.gc.ca/100/202/301/immigration_statistics-ef/mp22-1_1980.pdf
Canada Immigration Statistics 1980
(A.16) https://epe.lac-bac.gc.ca/100/202/301/immigration_statistics-ef/mp22-1_1981.pdf
Canada Immigration Statistics 1981
(A.17) https://epe.lac-bac.gc.ca/100/202/301/immigration_statistics-ef/mp22-1_1982.pdf
Canada Immigration Statistics 1982
(A.18) https://epe.lac-bac.gc.ca/100/202/301/immigration_statistics-ef/mp22-1_1983.pdf
Canada Immigration Statistics 1983
(A.19) https://epe.lac-bac.gc.ca/100/202/301/immigration_statistics-ef/mp22-1_1984.pdf
Canada Immigration Statistics 1984
(A.20) https://epe.lac-bac.gc.ca/100/202/301/immigration_statistics-ef/mp22-1_1985.pdf
Canada Immigration Statistics 1985
(A.21) https://epe.lac-bac.gc.ca/100/202/301/immigration_statistics-ef/mp22-1_1986.pdf
Canada Immigration Statistics 1986
(A.22) https://epe.lac-bac.gc.ca/100/202/301/immigration_statistics-ef/mp22-1_1987.pdf
Canada Immigration Statistics 1987
(A.23) https://epe.lac-bac.gc.ca/100/202/301/immigration_statistics-ef/mp22-1_1988.pdf
Canada Immigration Statistics 1988
(A.24) https://epe.lac-bac.gc.ca/100/202/301/immigration_statistics-ef/mp22-1_1989.pdf
Canada Immigration Statistics 1989
(A.25) https://epe.lac-bac.gc.ca/100/202/301/immigration_statistics-ef/mp22-1_1990.pdf
Canada Immigration Statistics 1990
(A.26) https://epe.lac-bac.gc.ca/100/202/301/immigration_statistics-ef/mp22-1_1991.pdf
Canada Immigration Statistics 1991
(A.27) https://epe.lac-bac.gc.ca/100/202/301/immigration_statistics-ef/mp22-1_1992.pdf
Canada Immigration Statistics 1992
(A.28) https://epe.lac-bac.gc.ca/100/202/301/immigration_statistics-ef/mp22-1_1993.pdf
Canada Immigration Statistics 1993
(A.29) https://epe.lac-bac.gc.ca/100/202/301/immigration_statistics-ef/mp22-1_1994.pdf
Canada Immigration Statistics 1994
(A.30) https://epe.lac-bac.gc.ca/100/202/301/immigration_statistics-ef/mp22-1_1995.pdf
Canada Immigration Statistics 1995
(A.31) https://epe.lac-bac.gc.ca/100/202/301/immigration_statistics-ef/mp22-1_1996.pdf
Canada Immigration Statistics 1996

2004.annual.immigration.report.to.parliament
2005.annual.immigration.report.to.parliament
2006.annual.immigration.report.to.parliament
2007.annual.immigration.report.to.parliament
2008.annual.immigration.report.to.parliament
2009.annual.immigration.report.to.parliament
2010.annual.immigration.report.to.parliament
2011.annual.immigration.report.to.parliament
2012.annual.immigration.report.to.parliament
2013.annual.immigration.report.to.parliament
2014.annual.immigration.report.to.parliament
2015.annual.immigration.report.to.parliament
2016.annual.immigration.report.to.parliament
2017.annual.immigration.report.to.parliament
2018.annual.immigration.report.to.parliament
2019.annual.immigration.report.to.parliament
2020.annual.immigration.report.to.parliament

U.N. Death Cult: 73 Million Abortions Annually Worldwide

The World Health Organization openly posts and discusses some pretty disturbing and messed up data on abortion worldwide. (See archive).

This expands on a recent Canuck Law article, which estimates that there have been over 4.2 million abortions just in Canada since 1970. This averages out to approximately 20% of pregnancies being willfully terminated. Few are aware of just how big this problem is.

Here are some claims W.H.O. promotes:

  • Abortion is a common health intervention. It is safe when carried out using a method recommended by WHO, appropriate to the pregnancy duration and by someone with the necessary skills.
  • Six out of 10 of all unintended pregnancies end in an induced abortion.
  • Around 45% of all abortions are unsafe, of which 97% take place in developing countries.
  • Unsafe abortion is a leading – but preventable – cause of maternal deaths and morbidities. It can lead to physical and mental health complications and social and financial burdens for women, communities and health systems.
  • Lack of access to safe, timely, affordable and respectful abortion care is a critical public health and human rights issue.

And this one is a doozy:

Around 73 million induced abortions take place worldwide each year. Six out of 10 (61%) of all unintended pregnancies, and 3 out of 10 (29%) of all pregnancies, end in induced abortion

This claim is based on work from Bearak J, Popinchalk A, Ganatra B, Moller A-B, Tunçalp Ö, Beavin C et al, which covered estimates from the years 1990 through 2019. They used a “Bayesian framework”, meaning dta on pregnancy intentions and abortion were compiled from country-based surveys, official statistics, and published studies found through a literature search. So, it’s not just a straight compilation, but estimates as well.

Of course, if this figure of 73 million, per year, is even remotely accurate, it would be somewhere between 2 and 5 billion children have been aborted since the 1970s, when the movement really took off.

Restrictive abortion regulation can cause distress and stigma, and risk constituting a violation of human rights of women and girls, including the right to privacy and the right to non-discrimination and equality, while also imposing financial burdens on women and girls. Regulations that force women to travel to attain legal care, or require mandatory counselling or waiting periods, lead to loss of income and other financial costs, and can make abortion inaccessible to women with low resources.

Estimates from 2006 show that complications of unsafe abortions cost health systems in developing countries US$ 553 million per year for post-abortion treatments. In addition, households experienced US$ 922 million in loss of income due to long-term disability related to unsafe abortion. Countries and health systems could make substantial monetary savings by providing greater access to modern contraception and quality induced abortion.

A set of scoping reviews from 2021 indicate that abortion regulations – by being linked to fertility – affect women’s education, participation on the labour market and positive contribution to GDP growth. The legal status of abortion can also affect children’s educational outcomes, and their earnings on the labour market later in life. For example, legalization of abortion – by reducing the number of unwanted pregnancies and thus increasing the likelihood that children are born wanted – can be linked to greater parental investments in children, including in girls’ schooling.

Does W.H.O. condemn the hundreds of millions — if not billions — of lives that are lost through this? Not exactly. The rights of the unborn never seem to factor into the equation.

W.H.O. attempts to make several economic arguments as to why abortion should be legal and as accessible as possible. Of course, they don’t seem to bother with addressing the long term physical and psychological impacts of women who do abort their children.

The World Health Organization also has its own division on Sexual and Reproductive Health and Research (SRH). (See archive). It’s funded both by various governments and private companies, including the Bill & Melinda Gates Foundation. (See archive). They always seem to be around whenever there are population reduction programs involved.

5.6 Ensure universal access to sexual and reproductive health and reproductive rights as agreed in accordance with the Programme of Action of the International Conference on population and Development and the Beijing Platform for Action and the outcome documents of their review conferences

Enshrining abortion is also written right into Agenda 2030, which was signed by “Conservative” Stephen Harper in 2015. (See archive). It’s item #5.6 on the Treaty.

One might think it strange that population control groups are interested in keeping abortion legal and readily available. Then again, once one realizes the scale of this mass infanticide, things start to make a whole lot more sense.

Furthermore, the W.H.O. and U.N. link to the U.N. Population Fund, their 2014 Programme of Action, and to the Beijing Declaration And Platform For Action. (See archive). In a sick twist, abortion is promoted as women’s rights, and pregnancy an often unwanted evil.

Of course, 50% or so of the babies who are killed would have grown up to become women. This is something that many women’s rights groups don’t get, or at least pretend they don’t.

It’s interesting that groups like the United Nations claim to be against child exploitation and human trafficking. That said, they support encourage practices that ensure the deaths of countless unborn, while their remains can be sold off for a variety of purposes.

It’s even more disturbing that the U.N. keeps detailed and up-to-date records of abortion regulations across countries. Guess it’s one way of tracking where the most victims are likely to come from.

Has abortion been stopped, or slowed over the last 2 1/2 years during this so-called pandemic? Not at all. In fact, it’s one of the few things that were still available in Canada the entire time. Sure, weddings, churches, and funerals were “non-essential”. However, abortion, weed and liquor were still accessible.

SOURCE MATERIAL
(1) https://www.who.int/news-room/fact-sheets/detail/abortion
(2) https://canucklaw.ca/eugenics-in-canada-20-of-babies-aborted-in-pro-choice-movement/
(3) https://pubmed.ncbi.nlm.nih.gov/32710833/
(4) https://www.who.int/teams/sexual-and-reproductive-health-and-research-(srh)/human-reproduction-programme
(5) https://archive.ph/uyd8J
(6) https://www.who.int/teams/sexual-and-reproductive-health-and-research-(srh)/human-reproduction-programme/donors
(7) https://archive.ph/7tb5Q
(8) https://www.un.org/ohrlls/sites/www.un.org.ohrlls/files/2030_agenda_for_sustainable_development_web.pdf
(9) 2030 Agenda for Sustainable Development web
(10) https://www.unfpa.org/publications/international-conference-population-and-development-programme-action
(11) https://www.unwomen.org/sites/default/files/Headquarters/Attachments/Sections/CSW/PFA_E_Final_WEB.pdf
(12) https://canucklaw.ca/wp-content/uploads/UN-Beijing-Declaration-And-Platform-For-Action.pdf
(13) https://www.who.int/emergencies/diseases/novel-coronavirus-2019/related-health-issues
(14) https://apps.who.int/iris/bitstream/handle/10665/331561/WHO-2019-nCoV-essential_health_services-2020.1-eng.pdf?sequence=1&isAllowed=y
(15) WHO-2019-nCoV Essential Health Services 2020 March 2020
(16) WHO-2019-nCoV-essential_health_services June 2020
(17) https://www.un.org/en/development/desa/population/publications/pdf/policy/AbortionPoliciesReproductiveHealth.pdf

Millions Got Rental Subsidy, CERS, Imposed Masks & Vaccine Passports

This article focuses on CERS, the Canada Emergency Rental Subsidy. Unlike the wage program, it doesn’t appear that there is a database to just search names. That said, we can still get some information from the statistics that are compiled.

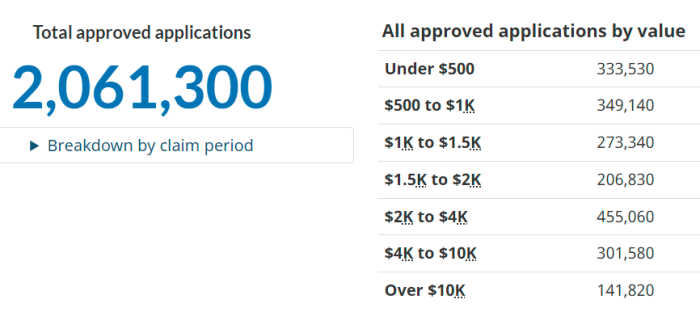
To start with the obvious: some 2 million applications have been approved. Considering that Canada is (supposedly) a country of 38 or 39 million people, that would suggest that a majority of businesses here got something.

From the data presented, it appears that the median (50% above, 50% below) amount given would be a little over $1,500. Seems to be pretty cheap to sell out for.

INDUSTRY APPROVALS
Agriculture, Forestry, Fishing & Hunting 860 $1,393,000 5,710
Mining, quarrying, and oil and gas extraction 180 $452,000 540
Utilities
Construction 2,670 $2,410,000 3,230
Manufacturing 3,470 $4,781,000 4,450
Wholesale Trade 2,530 $2,815,000 3,780
Retail Trade 7,780 $7,020,000 11,680
Transportation & Warehousing 3,210 $3,681,000 3,930
Information & Cultural Industries 800 $1,181,000 1,640
Finance & Insurance 700 $904,000 1,510
Real Estate & Rental & Leasing 1,960 $2,510,000 2,750
Professional, Scientific & Technical Services 5,030 $4,305,000 6,190
Management of Companies & Enterprises 140 $264,000 310
Administrative Support, Waste Management & Remediation Services 2,880 $3,004,000 3,740
Education Services 2,150 $2,419,000 2,600
Health Care & Social Assistance 3,810 $2,424,000 4,790
Arts, Entertainment & Recreation 2,620 $3,874,000 3,370
Accommodation & Food Services 13,690 $17,368,000 16,200
Other Services, except Public Administration 9,530 $6,184,000 11,460
Public Administration
Not Assigned 4,370 $4,643,000 4,910
Total – Period 14 68,400 $71,645,000 92,800
Total since launch 2,001,670 $7,557,399,000

Wonder why so many companies are willing to go along with vaccine passports and mask mandates? It’s reasonable to assume that the handouts, which include CERS, played a large role in that. This is how the Government is able to keep its hands — somewhat — clean. If they don’t impose mandates, but simply subsidize businesses to do it, then it’s viewed as private enterprise.

This continues the list of institutions that are getting funded to shill the “pandemic” narrative. These include: restaurants and hotels, political parties, law firms, more law firms, churches, trucking associations, chambers of commerce, financial institutions, the publishing industry, and gyms, just to name a few of them.

Remember: things often don’t make sense until you see the entire picture. This site tries to show you as much of it as possible, and money seems to always be the driving factor.

(1) https://www.canada.ca/content/dam/cra-arc/serv-info/tax/business/topics/cers/statistics/cers_tbl2.pdf
(2) Canada Emergency Rental Subsidy
(3) https://www.canada.ca/en/revenue-agency/services/wage-rent-subsidies/emergency-rent-subsidy/cers-statistics.html
(4) https://apps.cra-arc.gc.ca/ebci/hacc/cews/srch/pub/bscSrch
(5) https://apps.cra-arc.gc.ca/ebci/hacc/srch/pub/dsplyBscSrch?request_locale=en
(6) https://search.open.canada.ca/en/gc/
(7) https://lobbycanada.gc.ca/app/secure/ocl/lrs/do/advSrch

(A.1) Hotel, Restaurant Groups Getting Wage/Rental Subsidies
(A.2) Liberals, Conservatives, NDP All Getting Bailout Money
(A.3) Lawyers, Bar Associations Receiving CEWS Money
(A.4) Conflicting Out? Lawyers Getting More Than Just CEWS
(A.5) Churches Are Charities, Getting CEWS, Subsidies & Promoting Vaccines
(A.6) Trucking Alliance Grants Raising many Eyebrows
(A.7) Chambers Of Commerce Subsidized By Canadians, Want Open Borders
(A.8) Banks, Credit Unions, Media Outlets All Getting CEWS
(A.9) Publishing Industry Subsidized By Taxpayer Money
(A.10) Gyms, Fitness Centres Getting CEWS As They Mandate Masks, Vaxx Passports

(B.1) Unifor, Media, In Bed With Gov’t, $595M
(B.2) Government Subsidizes Media To Ensure Positive Coverage
(B.3) Postmedia Subsidies/Connections, Lack Of Real Journalism
(B.4) Latest “Pandemic Bucks” Grants In 2021, Lorrie Goldstein
(B.5) Nordstar; Torstar; Metroland Media; Subsidies & Monopoly
(B.6) Aberdeen Publishing Takes Handouts, Ignores Real Issues
(B.7) More Periodicals Taking Grants, Parroting Gov’t Narrative
(B.8) Tri-City News, LMP Pulls Bonnie Henry Article; Pandemic Bucks
(B.9) Black Press Group; Media Outlet Doxing Of Convoy Donors
(B.10) Subsidized Fact-Check Outlets Run By Political Operatives
(B.11) Digital Citizen Contribution Program: Funds To Combat “Misinformation”
(B.12) Counter Intelligence “Disinformation Prevention” Groups Are Charities
(B.13) CIVIX, More Grants To Combat “Disinformation” In 2021, Domestic, Foreign
(B.14) PHAC Supporting #ScienceUpFirst Counter Intel Effort
(B.15) Rockefeller Spends $13.5 To Combat Misinformation
(B.16) Media, Banks, CU, Getting CDA Emergency Wage Subsidies (CEWS)
(B.17) John Tory’s Sister Board Member At Bell; CEWS; Subsidies

(C.1) Media, Facebook, Google, Tech Collusion To Create “Trust” Networks
(C.2) CommonTrust, Commons Project, WEF, Rockefeller, Health Passes
(C.3) C2PA; Project Origin; Content Authenticity Initiative; CBC-BBC-Microsoft
(C.4) Public Media Alliance, Global Task Force, Brussels Declaration
(C.5) Institute For Strategic Dialogue: Govt/NGO Funded Counter-Intelligence
(C.6) Institute For Strategic Dialogue: Open Source Intelligence Gathering