

Here’s some data going back to the 1960s. These years feature quite differently than more recent reports. The United States and United Kingdom were consistently at the top of the source countries list. That has since been replaced by China, India and the Philippines. White genocide (a.k.a “replacement”) is a very real thing.
According to the United Nations, enacting policies designed to bring about the destruction of an ethnic, racial, or religious group (in all or in part), is considered genocide. Consequently, forced multiculturalism and population replacement should be viewed through that lens.
1. Mass LEGAL Immigration In Canada
Despite what many think, LEGAL immigration into Canada is actually a much larger threat than illegal aliens, given the true scale of the replacement that is happening. What was founded as a European (British) colony is becoming unrecognizable due to forced demographic changes. There are also social, economic, environmental and voting changes to consider. See this Canadian series, and the UN programs for more detail. Politicians, the media, and so-called “experts” have no interest in coming clean on this.
CLICK HERE, for UN Genocide Prevention/Punishment Convention.
CLICK HERE, for Barcelona Declaration & Kalergi Plan.
CLICK HERE, for UN Kalergi Plan (population replacement).
CLICK HERE, for UN replacement efforts since 1974.
CLICK HERE, for tracing steps of UN replacement agenda.
Note: If there are errors in calculating the totals, please speak up. Information is of no use to the public if it isn’t accurate.
2. Source Countries From 1966 To 1979

Let’s look at the “official” numbers from 1966 to 1979. The U.S. and U.K. are still featured prominently, something that will change in the coming years.
| SOURCE COUNTRY | NUMBER | PERCENTAGE | RANK |
|---|---|---|---|
| United Kingdom | 63,291 | 32.5 | 1 |
| Italy | 31,625 | 16.2 | 2 |
| United States | 17,514 | 9.0 | 3 |
| Germany | 9,263 | 4.8 | 4 |
| Portugal | 7,930 | 4.0 | 5 |
| France | 7,872 | 4.0 | 6 |
| Greece | 7,174 | 3.7 | 7 |
| China | 4,094 | 2.1 | 8 |
| West Indies | 3,935 | 2.0 | 9 |
| Netherlands | 3,794 | 1.9 | 10 |
| TOTAL — TOP 10 | 156,492 | 80.4 | — |
| TOTAL — OTHERS | 38,251 | 19.6 | — |
| GRAND TOTAL | 194,743 | 100 | — |
| SOURCE COUNTRY | NUMBER | PERCENTAGE | RANK |
|---|---|---|---|
| United Kingdom | 62,420 | 28.0 | 1 |
| Italy | 30,055 | 13.4 | 2 |
| United States | 19,038 | 8.6 | 3 |
| Germany | 11,779 | 5.3 | 4 |
| Greece | 10,650 | 4.6 | 5 |
| France | 10,122 | 4.5 | 6 |
| Portugal | 9,500 | 4.2 | 7 |
| West Indies | 8,403 | 3.8 | 8 |
| China | 6,409 | 2.9 | 9 |
| Australia | 4,967 | 2.2 | 10 |
| TOTAL — TOP 10 | 173,343 | 77.8 | — |
| TOTAL — OTHERS | 49,533 | 22.2 | — |
| GRAND TOTAL | 222,876 | 100 | — |
| SOURCE COUNTRY | NUMBER | PERCENTAGE | RANK |
|---|---|---|---|
| United Kingdom | 37,889 | 20.6 | 1 |
| United States | 20,422 | 11.1 | 2 |
| Italy | 19,774 | 10.8 | 3 |
| Germany | 8,966 | 4.8 | 4 |
| China | 8,382 | 4.6 | 5 |
| France | 8,184 | 4.4 | 6 |
| Austria | 8,125 | 4.4 | 7 |
| Greece | 7,739 | 4.2 | 8 |
| Portugal | 7,738 | 4.2 | 9 |
| West Indies | 7,563 | 4.1 | 10 |
| TOTAL — TOP 10 | 104,782 | 57.0 | — |
| TOTAL — OTHERS | 79,192 | 43.0 | — |
| GRAND TOTAL | 183,974 | 100 | — |
| SOURCE COUNTRY | NUMBER | PERCENTAGE | RANK |
|---|---|---|---|
| United Kingdom | 31,977 | 19.8 | 1 |
| United States | 22,785 | 14.1 | 2 |
| West Indies | 13,093 | 8.1 | 3 |
| Italy | 10,383 | 6.4 | 4 |
| China | 8,272 | 5.1 | 5 |
| Portugal | 7,182 | 4.4 | 6 |
| Greece | 6,937 | 4.3 | 7 |
| Germany | 5,880 | 3.6 | 8 |
| France | 5,549 | 3.4 | 9 |
| India | 5,395 | 3.3 | 10 |
| TOTAL — TOP 10 | 117,453 | 72.7 | — |
| TOTAL — OTHERS | 44,078 | 27.3 | — |
| GRAND TOTAL | 161,531 | 100 | — |
| SOURCE COUNTRY | NUMBER | PERCENTAGE | RANK |
|---|---|---|---|
| United Kingdom | 26,497 | 18.7 | 1 |
| United States | 24,424 | 16.5 | 2 |
| West Indies | 12,456 | 8.4 | 3 |
| Italy | 8,533 | 5.8 | 4 |
| Portugal | 7,902 | 5.4 | 5 |
| Greece | 6,327 | 4.3 | 6 |
| Yugoslavia | 5,672 | 3.8 | 7 |
| India | 5,670 | 3.8 | 8 |
| China | 5,377 | 3.6 | 9 |
| France | 4,410 | 2.9 | 10 |
| TOTAL — TOP 10 | 101,596 | 68.8 | — |
| TOTAL — OTHERS | 46,118 | 31.2 | — |
| GRAND TOTAL | 147,714 | 100 | — |
| SOURCE COUNTRY | NUMBER | PERCENTAGE | RANK |
|---|---|---|---|
| United States | 24,366 | 20.0 | 1 |
| United Kingdom | 15,451 | 12.8 | 2 |
| Portugal | 9,157 | 7.5 | 3 |
| Italy | 5,790 | 4.8 | 4 |
| India | 5,313 | 4.4 | 5 |
| China | 5,009 | 4.1 | 6 |
| Greece | 4,769 | 3.9 | 7 |
| Philippines | 4,180 | 3.4 | 8 |
| Yugoslavia | 2,997 | 2.4 | 9 |
| France | 2,966 | 2.4 | 10 |
| TOTAL — TOP 10 | 79,998 | 66.6 | — |
| TOTAL — OTHERS | 41,902 | 34.4 | — |
| GRAND TOTAL | 121,900 | 100 | — |
| SOURCE COUNTRY | NUMBER | PERCENTAGE | RANK |
|---|---|---|---|
| United States | 22,618 | 18.5 | 1 |
| United Kingdom | 18,197 | 14.9 | 2 |
| Portugal | 8,737 | 7.2 | 3 |
| Hong Kong | 6,297 | 5.2 | 4 |
| India | 5,049 | 4.1 | 5 |
| Uganda | 5,021 | 4.1 | 6 |
| Italy | 4,608 | 3.8 | 7 |
| Greece | 4,016 | 3.3 | 8 |
| Philippines | 3,946 | 3.2 | 9 |
| France | 2,742 | 2.2 | 10 |
| TOTAL — TOP 10 | 81,231 | 66.6 | — |
| TOTAL — OTHERS | 40,775 | 33.4 | — |
| GRAND TOTAL | 122,006 | 100 | — |
| SOURCE COUNTRY | NUMBER | PERCENTAGE | RANK |
|---|---|---|---|
| United Kingdom | 26,973 | 14.6 | 1 |
| United States | 25,242 | 13.7 | 2 |
| Hong Kong | 14,662 | 8.0 | 3 |
| Portugal | 13,483 | 7.3 | 4 |
| Jamaica | 9,363 | 5.1 | 5 |
| India | 9,203 | 5.0 | 6 |
| Philippines | 6,757 | 3.7 | 7 |
| Greece | 5,833 | 3.2 | 8 |
| Italy | 5,468 | 3.0 | 9 |
| Trinidad-Tobago | 5,138 | 2.8 | 10 |
| TOTAL — TOP 10 | 122,122 | 66.3 | — |
| TOTAL — OTHERS | 62,078 | 33.7 | — |
| GRAND TOTAL | 184,200 | 100 | — |
| SOURCE COUNTRY | NUMBER | PERCENTAGE | RANK |
|---|---|---|---|
| United Kingdom | 38,456 | 17.6 | 1 |
| United States | 26,541 | 12.1 | 2 |
| Portugal | 16,333 | 7.5 | 3 |
| India | 12,868 | 5.9 | 4 |
| Hong Kong | 12,704 | 5.8 | 5 |
| Jamaica | 11,286 | 5.2 | 6 |
| Philippines | 9,564 | 4.4 | 7 |
| Greece | 5,632 | 2.6 | 8 |
| Italy | 5,226 | 2.4 | 9 |
| Haiti | 4,857 | 2.2 | 10 |
| TOTAL — TOP 10 | 143,467 | 65.7 | — |
| TOTAL — OTHERS | 74,998 | 34.3 | — |
| GRAND TOTAL | 218,465 | 100 | — |
| SOURCE COUNTRY | NUMBER | PERCENTAGE | RANK |
|---|---|---|---|
| United Kingdom | 34,978 | 18.6 | 1 |
| United States | 20,155 | 10.7 | 2 |
| Hong Kong | 11,132 | 5.9 | 3 |
| India | 10,144 | 5.4 | 4 |
| Portugal | 8,390 | 4.5 | 5 |
| Jamaica | 8,211 | 4.4 | 6 |
| Philippines | 7,364 | 3.9 | 7 |
| Italy | 5,078 | 2.7 | 8 |
| Guyana | 4,394 | 2.3 | 9 |
| South Korea | 4,314 | 2.3 | 10 |
| TOTAL — TOP 10 | 114,163 | 60.8 | — |
| TOTAL — OTHERS | 73,718 | 39.2 | — |
| GRAND TOTAL | 187,881 | 100 | — |
| SOURCE COUNTRY | NUMBER | PERCENTAGE | RANK |
|---|---|---|---|
| United Kingdom | 21,548 | 14.4 | 1 |
| United States | 17,315 | 11.6 | 2 |
| Hong Kong | 10,725 | 7.2 | 3 |
| Jamaica | 7,282 | 4.9 | 4 |
| Lebanon | 7,161 | 4.8 | 5 |
| India | 6,733 | 4.5 | 6 |
| Philippines | 5,939 | 4.0 | 7 |
| Portugal | 5,344 | 3.6 | 8 |
| Italy | 4,530 | 3.0 | 9 |
| Guyana | 3,430 | 2.3 | 10 |
| TOTAL — TOP 10 | 90,007 | 60.2 | — |
| TOTAL — OTHERS | 59,422 | 39.8 | — |
| GRAND TOTAL | 149,429 | 100 | — |
| SOURCE COUNTRY | NUMBER | PERCENTAGE | RANK |
|---|---|---|---|
| United Kingdom | 17,977 | 15.6 | 1 |
| United States | 12,888 | 11.2 | 3 |
| Hong Kong | 6,371 | 5.5 | 3 |
| Philippines | 6,232 | 5.4 | 4 |
| India | 5,555 | 4.8 | 5 |
| Lebanon | 3,847 | 3.3 | 6 |
| Portugal | 3,579 | 3.1 | 7 |
| Italy | 3,411 | 3.0 | 8 |
| France | 2,757 | 2.4 | 9 |
| Guyana | 2,472 | 2.4 | 10 |
| TOTAL — TOP 10 | 65,089 | 56.7 | — |
| TOTAL — OTHERS | 49,825 | 43.3 | — |
| GRAND TOTAL | 114,914 | 100 | — |
| SOURCE COUNTRY | NUMBER | PERCENTAGE | RANK |
|---|---|---|---|
| United Kingdom | 11,801 | 13.7 | 1 |
| United States | 9,945 | 11.5 | 2 |
| India | 5,110 | 5.9 | 3 |
| Hong Kong | 4,740 | 5.5 | 4 |
| Philippines | 4,370 | 5.1 | 5 |
| Portugal | 3,086 | 3.6 | 6 |
| Italy | 2,976 | .43 | 7 |
| France | 1,754 | 2.9 | 8 |
| South Africa | 1,653 | 1.9 | 9 |
| Lebanon | 1,454 | 1.7 | 10 |
| TOTAL — TOP 10 | 46,880 | 54.3 | — |
| TOTAL — OTHERS | 39,424 | 45.7 | — |
| GRAND TOTAL | 86,313 | 100 | — |
| SOURCE COUNTRY | NUMBER | PERCENTAGE | RANK |
|---|---|---|---|
| Vietnam | 19,859 | 17.7 | 1 |
| United Kingdom | 12,853 | 11.5 | 2 |
| United States | 9,617 | 8.6 | 3 |
| Hong Kong | 5,966 | 5.3 | 4 |
| India | 4,517 | 4.0 | 5 |
| Laos | 3,903 | 3.5 | 6 |
| Philippines | 3,873 | 3.5 | 7 |
| Jamaica | 3,213 | 2.9 | 8 |
| Guyana | 2,473 | 2.2 | 9 |
| China | 2,058 | 2.1 | 10 |
| TOTAL — TOP 10 | 68,332 | 61.0 | — |
| TOTAL — OTHERS | 43,764 | 39.0 | — |
| GRAND TOTAL | 112,096 | 100 | — |
Permanent Residents: U.S., Europe and Australia as a percentage of overall migration globally. The vast majority of people getting PR in recent years aren’t from those areas.
| YEAR | # U.S. | % U.S. | # Eur. | % Eur. | # Aust | % Austr | # Other | % Other |
|---|---|---|---|---|---|---|---|---|
| 1973 | 25,242 | 13.7 | 71,883 | 39.0 | 2,096 | 1.1 | 84,979 | 46.1 |
| 1974 | 26,541 | 12.1 | 88,694 | 40.6 | 2,022 | 0.1 | 102,208 | 46.3 |
| 1975 | 20,155 | 10.7 | 72,898 | 38.8 | 1,654 | 0.1 | 87,174 | 46.4 |
| 1976 | 17,315 | 11.5 | 49,908 | 33.3 | 1,387 | 0.1 | 80,819 | 54.1 |
| 1977 | 12,888 | 11.2 | 40,747 | 35.5 | 1,063 | 0.1 | 60,216 | 52.4 |
| 1978 | 9,945 | 11.5 | 30,075 | 34.8 | 1,233 | 1.4 | 45,060 | 52.2 |
| 1979 | 9,617 | 8.6 | 32,858 | 29.3 | 808 | 0.1 | 68,813 | 61.4 |
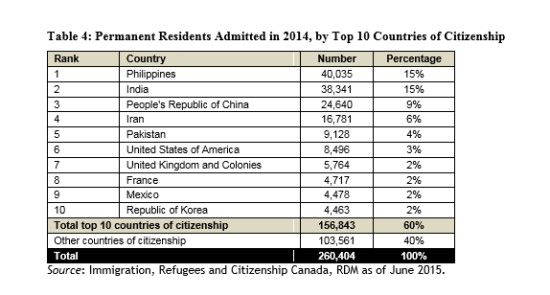
3. More Recent Statistics On Immigration Source Countries
The above may not seem too bad, but keep in mind that the trends are about to get a whole lot worse. Here are numbers from within the last decade. Of course, this doesn’t include the hordes of students and “temporary” workers who come and don’t leave.
(Page 16 of the 2015 Annual Report to Parliament)
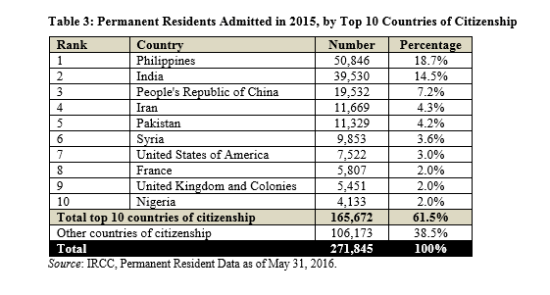
(Page 10 of the 2016 Annual Report to Parliament)
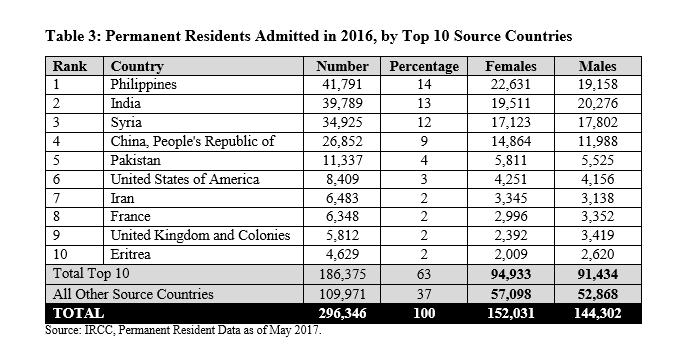
(Page 14 of the 2017 Annual Report to Parliament)
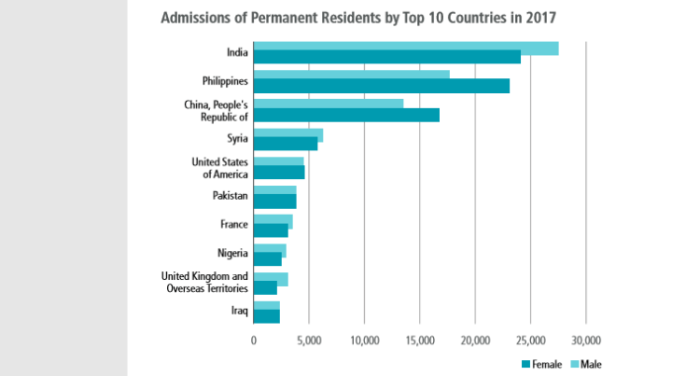
(Page 28 of the 2018 Annual Report to Parliament)
(Page 36 of the 2019 Annual Report to Parliament)
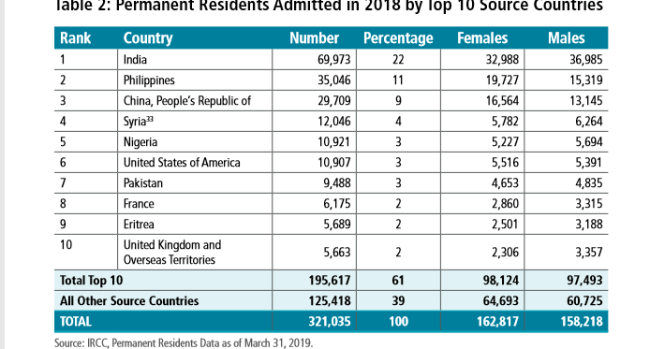
Notice any major changes? The U.K. and U.S. are nowhere near as prominent as they once were, and the demographic replacement is accelerating.
Of course, this doesn’t address the levels of student visas and “temporary” workers, which would increase drastically in the coming years.
4. Documents Provided By Canadian Government
(A.0) https://epe.lac-bac.gc.ca/100/202/301/immigration_statistics-ef/index.html
(A.1) https://epe.lac-bac.gc.ca/100/202/301/immigration_statistics-ef/mp22-1_1966.pdf
Canada Immigration Statistics 1966
(A.2) https://epe.lac-bac.gc.ca/100/202/301/immigration_statistics-ef/mp22-1_1967.pdf
Canada Immigration Statistics 1967
(A.3) https://epe.lac-bac.gc.ca/100/202/301/immigration_statistics-ef/mp22-1_1968.pdf
Canada Immigration Statistics 1968
(A.4) https://epe.lac-bac.gc.ca/100/202/301/immigration_statistics-ef/mp22-1_1969.pdf
Canada Immigration Statistics 1969
(A.5) https://epe.lac-bac.gc.ca/100/202/301/immigration_statistics-ef/mp22-1_1970.pdf
Canada Immigration Statistics 1970
(A.6) https://epe.lac-bac.gc.ca/100/202/301/immigration_statistics-ef/mp22-1_1971.pdf
Canada Immigration Statistics 1971
(A.7) https://epe.lac-bac.gc.ca/100/202/301/immigration_statistics-ef/mp22-1_1972.pdf
Canada Immigration Statistics 1972
(A.8) https://epe.lac-bac.gc.ca/100/202/301/immigration_statistics-ef/mp22-1_1973.pdf
Canada Immigration Statistics 1973
(A.9) https://epe.lac-bac.gc.ca/100/202/301/immigration_statistics-ef/mp22-1_1974.pdf
Canada Immigration Statistics 1974
(A.10) https://epe.lac-bac.gc.ca/100/202/301/immigration_statistics-ef/mp22-1_1975.pdf
Canada Immigration Statistics 1975
(A.11) https://epe.lac-bac.gc.ca/100/202/301/immigration_statistics-ef/mp22-1_1976.pdf
Canada Immigration Statistics 1976
(A.12) https://epe.lac-bac.gc.ca/100/202/301/immigration_statistics-ef/mp22-1_1977.pdf
Canada Immigration Statistics 1977
(A.13) https://epe.lac-bac.gc.ca/100/202/301/immigration_statistics-ef/mp22-1_1978.pdf
Canada Immigration Statistics 1978
(A.14) https://epe.lac-bac.gc.ca/100/202/301/immigration_statistics-ef/mp22-1_1979.pdf
Canada Immigration Statistics 1979
(A.15) https://epe.lac-bac.gc.ca/100/202/301/immigration_statistics-ef/mp22-1_1980.pdf
Canada Immigration Statistics 1980
(A.16) https://epe.lac-bac.gc.ca/100/202/301/immigration_statistics-ef/mp22-1_1981.pdf
Canada Immigration Statistics 1981
(A.17) https://epe.lac-bac.gc.ca/100/202/301/immigration_statistics-ef/mp22-1_1982.pdf
Canada Immigration Statistics 1982
(A.18) https://epe.lac-bac.gc.ca/100/202/301/immigration_statistics-ef/mp22-1_1983.pdf
Canada Immigration Statistics 1983
(A.19) https://epe.lac-bac.gc.ca/100/202/301/immigration_statistics-ef/mp22-1_1984.pdf
Canada Immigration Statistics 1984
(A.20) https://epe.lac-bac.gc.ca/100/202/301/immigration_statistics-ef/mp22-1_1985.pdf
Canada Immigration Statistics 1985
(A.21) https://epe.lac-bac.gc.ca/100/202/301/immigration_statistics-ef/mp22-1_1986.pdf
Canada Immigration Statistics 1986
(A.22) https://epe.lac-bac.gc.ca/100/202/301/immigration_statistics-ef/mp22-1_1987.pdf
Canada Immigration Statistics 1987
(A.23) https://epe.lac-bac.gc.ca/100/202/301/immigration_statistics-ef/mp22-1_1988.pdf
Canada Immigration Statistics 1988
(A.24) https://epe.lac-bac.gc.ca/100/202/301/immigration_statistics-ef/mp22-1_1989.pdf
Canada Immigration Statistics 1989
(A.25) https://epe.lac-bac.gc.ca/100/202/301/immigration_statistics-ef/mp22-1_1990.pdf
Canada Immigration Statistics 1990
(A.26) https://epe.lac-bac.gc.ca/100/202/301/immigration_statistics-ef/mp22-1_1991.pdf
Canada Immigration Statistics 1991
(A.27) https://epe.lac-bac.gc.ca/100/202/301/immigration_statistics-ef/mp22-1_1992.pdf
Canada Immigration Statistics 1992
(A.28) https://epe.lac-bac.gc.ca/100/202/301/immigration_statistics-ef/mp22-1_1993.pdf
Canada Immigration Statistics 1993
(A.29) https://epe.lac-bac.gc.ca/100/202/301/immigration_statistics-ef/mp22-1_1994.pdf
Canada Immigration Statistics 1994
(A.30) https://epe.lac-bac.gc.ca/100/202/301/immigration_statistics-ef/mp22-1_1995.pdf
Canada Immigration Statistics 1995
(A.31) https://epe.lac-bac.gc.ca/100/202/301/immigration_statistics-ef/mp22-1_1996.pdf
Canada Immigration Statistics 1996
2004.annual.immigration.report.to.parliament
2005.annual.immigration.report.to.parliament
2006.annual.immigration.report.to.parliament
2007.annual.immigration.report.to.parliament
2008.annual.immigration.report.to.parliament
2009.annual.immigration.report.to.parliament
2010.annual.immigration.report.to.parliament
2011.annual.immigration.report.to.parliament
2012.annual.immigration.report.to.parliament
2013.annual.immigration.report.to.parliament
2014.annual.immigration.report.to.parliament
2015.annual.immigration.report.to.parliament
2016.annual.immigration.report.to.parliament
2017.annual.immigration.report.to.parliament
2018.annual.immigration.report.to.parliament
2019.annual.immigration.report.to.parliament
2020.annual.immigration.report.to.parliament
Re-education camps for the non-global citizens … perhaps in your future?
2008 Niki Raapana and Melodee Hallett at this link:
https://soundcloud.com/kata-list-productions/niki-raapana-interview-2008