Note: This is a continuation of the recent piece, which covered the years from 1989 through 1998. The data needs to be shown in order to fully demonstrate what’s really going on.
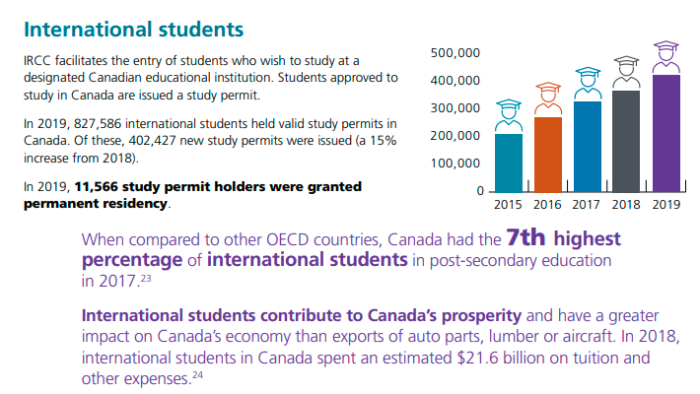
This piece does come with an obvious disclaimer: it doesn’t take the hordes of “temporary” workers and student visas in account. That will be addressed elsewhere.
The Kalergi Plan was laid out for Europe a century ago. The goal was to ultimately get rid of all the whites, with a combination of open doors immigration, depressed local birth rates, and miscegenation. That said, the plot it not limited to Europe, but to all white countries.
1. Mass LEGAL Immigration In Canada
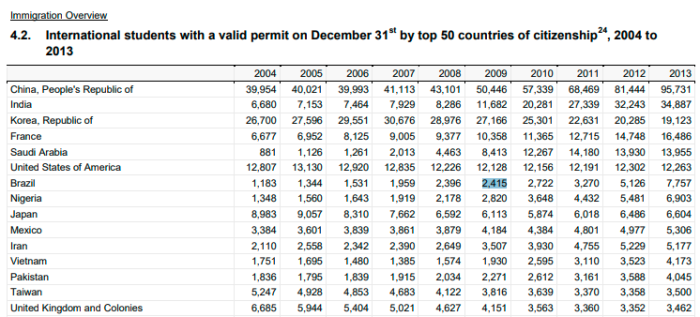
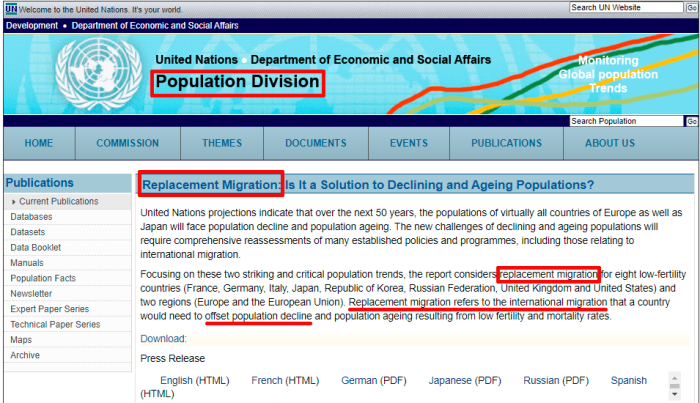
Despite what many think, LEGAL immigration into Canada is actually a much larger threat than illegal aliens, given the true scale of the replacement that is happening. What was founded as a European (British) colony is becoming unrecognizable due to forced demographic changes. There are also social, economic, environmental and voting changes to consider. See this Canadian series, and the UN programs for more detail. Politicians, the media, and so-called “experts” have no interest in coming clean on this.
CLICK HERE, for UN Genocide Prevention/Punishment Convention.
CLICK HERE, for Barcelona Declaration & Kalergi Plan.
CLICK HERE, for UN Kalergi Plan (population replacement).
CLICK HERE, for UN replacement efforts since 1974.
CLICK HERE, for tracing steps of UN replacement agenda.
Note: If there are errors in calculating the totals, please speak up. Information is of no use to the public if it isn’t accurate.
2. Replacement Migration Fits U.N. Definition Of Genocide
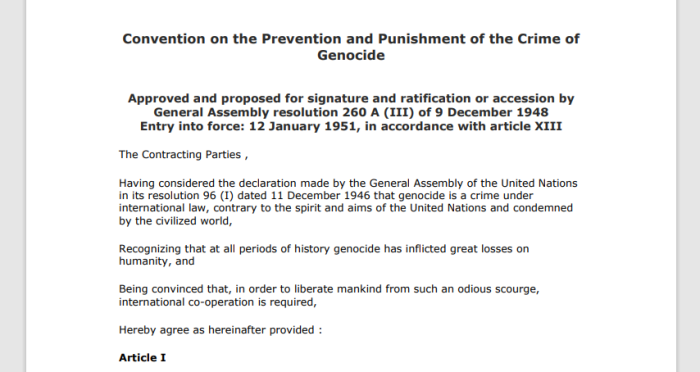
Isn’t trying to replace or displace a population considered genocide by the United Nations? Well, it does fit their own definitions….
Article I
The Contracting Parties confirm that genocide, whether committed in time of peace or in time of war, is a crime under international law which they undertake to prevent and to punish.
Article II
In the present Convention, genocide means any of the following acts committed with intent to destroy, in whole or in part, a national, ethnical, racial or religious group, as such:
(a) Killing members of the group;
(b) Causing serious bodily or mental harm to members of the group;
(c) Deliberately inflicting on the group conditions of life calculated to bring about its physical destruction in whole or in part;
(d) Imposing measures intended to prevent births within the group;
(e) Forcibly transferring children of the group to another group.
Article III
The following acts shall be punishable:
(a) Genocide;
(b) Conspiracy to commit genocide;
(c) Direct and public incitement to commit genocide;
(d) Attempt to commit genocide;
(e) Complicity in genocide.
Article IV
Persons committing genocide or any of the other acts enumerated in article III shall be punished, whether they are constitutionally responsible rulers, public officials or private individuals.
Article V
The Contracting Parties undertake to enact, in accordance with their respective Constitutions, the necessary legislation to give effect to the provisions of the present Convention, and, in particular, to provide effective penalties for persons guilty of genocide or any of the other acts enumerated in article III.
It’s also worth asking if pluralism (imposed without the consent of the people) would amount to genocide under the terms as laid out by the U.N. in the Convention on the Prevention and Punishment of the Crime of Genocide After all, if pluralism results in at least a partial replacement of a group, isn’t that bringing about its destruction?
3. Genocidal Population Replacement Long Time Problem
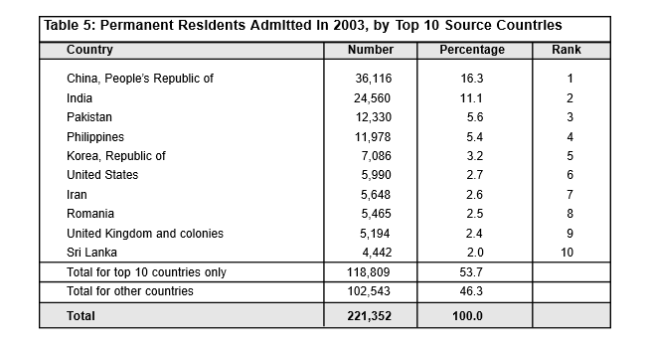
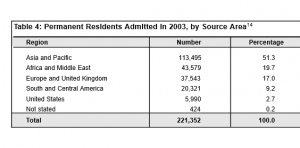
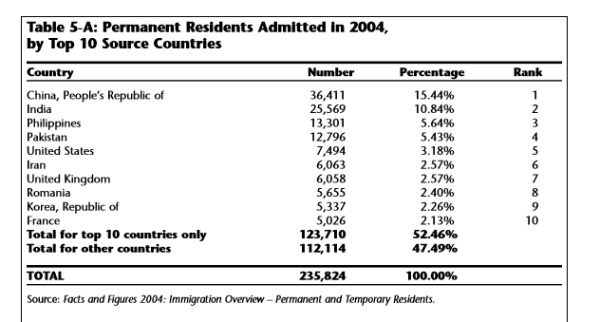
Let’s have a look at some of those recent years. While 2003 to 2020 has already been covered pretty extensively on this site, the problem extends much further than that.
| PERMANENT RESIDENTS IN YEAR 1980 |
| SOURCE COUNTRY |
NUMBER |
PERCENTAGE |
RANK |
| Vietnam |
25,541 |
17.8 |
1 |
| United Kingdom |
18,245 |
12.8 |
2 |
| United States |
9,926 |
6.9 |
3 |
| India |
8,483 |
5.9 |
4 |
| Hong Kong |
6,309 |
4.4 |
5 |
| Laos |
6,206 |
4.4 |
6 |
| Philippines |
6,051 |
4.2 |
7 |
| China |
4,936 |
3.5 |
8 |
| Portugal |
4,228 |
3.0 |
9 |
| TOTAL — TOP 9 |
89,955 |
62.9 |
— |
| TOTAL — OTHERS |
53,132 |
37.1 |
— |
| GRAND TOTAL |
143,087 |
100 |
— |
| PERMANENT RESIDENTS ADMITTED BY REGION IN 1980 |
| REGION |
NUMBER |
PERCENTAGE |
| Africa |
4,330 |
3.0 |
| Asia |
71,062 |
50.0 |
| South America |
5,433 |
3.8 |
| Caribbean/Antilles |
7,362 |
5.2 |
| United States |
9,926 |
6.9 |
| Europe and the United Kingdom |
41,168 |
28.8 |
| Others |
3,297 |
2.8 |
| Total |
143,087 |
100 |
| PERMANENT RESIDENTS IN YEAR 1981 |
| SOURCE COUNTRY |
NUMBER |
PERCENTAGE |
RANK |
| United Kingdom |
21,154 |
16.5 |
1 |
| United States |
10,559 |
8.2 |
2 |
| India |
8,256 |
6.4 |
3 |
| Vietnam |
8,251 |
6.4 |
4 |
| China |
6,550 |
5.1 |
5 |
| Hong Kong |
6,451 |
5.0 |
6 |
| Philippines |
5,859 |
4.6 |
7 |
| Poland |
3,850 |
3.0 |
8 |
| Haiti |
3,667 |
2.8 |
9 |
| TOTAL — TOP 9 |
74,594 |
58 |
— |
| TOTAL — OTHERS |
54,021 |
42.0 |
— |
| GRAND TOTAL |
128,618 |
100 |
— |
| PERMANENT RESIDENTS ADMITTED BY REGION IN 1981 |
| REGION |
NUMBER |
PERCENTAGE |
| Africa |
4,887 |
3.8 |
| Asia |
48,830 |
38.0 |
| South America |
6,136 |
4.8 |
| Caribbean/Antilles |
8,633 |
6.7 |
| United States |
10,559 |
8.2 |
| Europe and the United Kingdom |
46,295 |
36.0 |
| Others |
3,278 |
2.5 |
| Total |
128,618 |
100 |
| PERMANENT RESIDENTS IN YEAR 1982 |
| SOURCE COUNTRY |
NUMBER |
PERCENTAGE |
RANK |
| United Kingdom |
16,445 |
13.6 |
1 |
| United States |
9,360 |
7.7 |
2 |
| Poland |
8,278 |
6.8 |
3 |
| India |
7,776 |
6.4 |
4 |
| Hong Kong |
6,542 |
5.4 |
5 |
| Vietnam |
5,935 |
4.9 |
6 |
| Philippines |
5,062 |
4.2 |
7 |
| Germany |
4,425 |
3.7 |
8 |
| China |
3,571 |
2.9 |
9 |
| TOTAL — TOP 9 |
67,414 |
55.6 |
— |
| TOTAL — OTHERS |
57,753 |
44.4 |
— |
| GRAND TOTAL |
121,167 |
100 |
— |
| PERMANENT RESIDENTS ADMITTED BY REGION IN 1982 |
| REGION |
NUMBER |
PERCENTAGE |
| Africa |
4,510 |
3.7 |
| Asia |
41,617 |
34.3 |
| South America |
6,870 |
5.7 |
| Caribbean/Antilles |
8,674 |
7.2 |
| United States |
9,360 |
7.7 |
| Europe and the United Kingdom |
46,150 |
38.1 |
| Others |
3,966 |
3.3 |
| Total |
121,167 |
100 |
| PERMANENT RESIDENTS IN YEAR 1983 |
| SOURCE COUNTRY |
NUMBER |
PERCENTAGE |
RANK |
| United States |
7,381 |
8.3 |
1 |
| India |
7,041 |
7.9 |
2 |
| Hong Kong |
6,710 |
7.5 |
3 |
| Vietnam |
6,451 |
7.2 |
4 |
| United Kingdom |
5,737 |
6.4 |
5 |
| Poland |
5,094 |
5.7 |
6 |
| Philippines |
4,454 |
5.1 |
7 |
| Haiti |
2,827 |
3.2 |
8 |
| Guyana |
2,605 |
2.9 |
9 |
| TOTAL — TOP 9 |
48,300 |
54.2 |
— |
| TOTAL — OTHERS |
40,857 |
45.8 |
— |
| GRAND TOTAL |
89,157 |
100 |
— |
| PERMANENT RESIDENTS ADMITTED BY REGION IN 1983 |
| REGION |
NUMBER |
PERCENTAGE |
| Africa |
3,659 |
4.1 |
| Asia |
36,906 |
41.4 |
| South America |
4,816 |
5.4 |
| Caribbean/Antilles |
7,216 |
8.1 |
| United States |
7,381 |
8.3 |
| Europe and the United Kingdom |
24,312 |
27.3 |
| Others |
4,867 |
5.4 |
| Total |
89,157 |
100 |
| PERMANENT RESIDENTS IN YEAR 1984 |
| SOURCE COUNTRY |
NUMBER |
PERCENTAGE |
RANK |
| Vietnam |
10,950 |
12.4 |
1 |
| Hong Kong |
7,696 |
8.7 |
2 |
| United States |
6,922 |
7.8 |
3 |
| India |
5,502 |
6.2 |
4 |
| United Kingdom |
5,104 |
5.8 |
5 |
| Poland |
4,499 |
5.1 |
6 |
| Philippines |
3,748 |
4.2 |
7 |
| El Salvador |
2,569 |
2.9 |
8 |
| Jamaica |
2,479 |
2.8 |
9 |
| TOTAL — TOP 9 |
49,479 |
56.1 |
— |
| TOTAL — OTHERS |
38,760 |
43.9 |
— |
| GRAND TOTAL |
88,239 |
100 |
— |
| PERMANENT RESIDENTS ADMITTED BY REGION IN 1984 |
| REGION |
NUMBER |
PERCENTAGE |
| Africa and the Middle East |
3,552 |
4.0 |
| Asia |
41,920 |
47.5 |
| South America |
4,085 |
4.6 |
| Caribbean/Antilles |
5,630 |
6.4 |
| United States |
6,922 |
7.8 |
| Europe and the United Kingdom |
20,901 |
23.7 |
| Others |
5,229 |
5.9 |
| Total |
88,239 |
100 |
| PERMANENT RESIDENTS IN YEAR 1985 |
| SOURCE COUNTRY |
NUMBER |
PERCENTAGE |
RANK |
| Vietnam |
10,404 |
12.3 |
1 |
| Hong Kong |
7,380 |
8.8 |
2 |
| United States |
6,669 |
7.9 |
3 |
| United Kingdom |
4,454 |
5.3 |
4 |
| India |
4,028 |
4.8 |
5 |
| Poland |
3,617 |
4.3 |
6 |
| Philippines |
3,076 |
3.6 |
7 |
| Jamaica |
2,922 |
3.5 |
8 |
| El Salvador |
2,881 |
3.4 |
9 |
| Guyana |
2,301 |
2.7 |
10 |
| TOTAL — TOP 10 |
47,732 |
56.6 |
— |
| TOTAL — OTHERS |
36,570 |
43.4 |
— |
| GRAND TOTAL |
84,302 |
100 |
— |
| PERMANENT RESIDENTS ADMITTED BY REGION IN 1985 |
| REGION |
NUMBER |
PERCENTAGE |
| Africa and the Middle East |
3,545 |
4.2 |
| Asia and Pacific |
38,597 |
45.8 |
| South America |
4,356 |
4.2 |
| North/Central America |
5,016 |
6.0 |
| Caribbean/Antilles |
6,132 |
7.2 |
| United States |
6,669 |
7.2 |
| Europe and the United Kingdom |
18,859 |
22.4 |
| Others |
1,128 |
1.2 |
| Total |
84,302 |
100 |
| PERMANENT RESIDENTS IN YEAR 1986 |
| SOURCE COUNTRY |
NUMBER |
PERCENTAGE |
RANK |
| United States |
7,275 |
7.3 |
1 |
| India |
6,940 |
7.0 |
2 |
| Vietnam |
6,622 |
6.7 |
3 |
| Hong Kong |
5,893 |
5.9 |
4 |
| Poland |
5,231 |
5.3 |
5 |
| United Kingdom |
5,088 |
5.1 |
6 |
| Jamaica |
4,652 |
4.7 |
7 |
| Philippines |
4,102 |
4.1 |
8 |
| Guyana |
3,905 |
4.0 |
9 |
| El Salvador |
3,167 |
3.2 |
10 |
| TOTAL — TOP 10 |
52,875 |
53.3 |
— |
| TOTAL — OTHERS |
46,344 |
46.7 |
— |
| GRAND TOTAL |
99,219 |
100 |
— |
| PERMANENT RESIDENTS ADMITTED BY REGION IN 1986 |
| REGION |
NUMBER |
PERCENTAGE |
| Africa and the Middle East |
4,770 |
4.8 |
| Asia and Pacific |
41,600 |
41.9 |
| South America |
6,686 |
6.7 |
| North/Central America |
6,078 |
6.1 |
| Caribbean/Antilles |
8,874 |
9.0 |
| United States |
7,275 |
7.4 |
| Europe and the United Kingdom |
22,709 |
22.9 |
| Others |
1,227 |
1.2 |
| Total |
99,219 |
100 |
| PERMANENT RESIDENTS IN YEAR 1987 |
| SOURCE COUNTRY |
NUMBER |
PERCENTAGE |
RANK |
| Hong Kong |
16,170 |
10.6 |
1 |
| India |
9,692 |
6.4 |
2 |
| United Kingdom |
8,547 |
5.6 |
3 |
| United States |
7,967 |
5.2 |
4 |
| Philippines |
7,343 |
4.8 |
5 |
| Portugal |
7,300 |
4.8 |
6 |
| Poland |
7,036 |
4.7 |
7 |
| Guyana |
6,073 |
4.0 |
8 |
| Vietnam |
5,668 |
3.7 |
9 |
| Jamaica |
5,422 |
3.6 |
10 |
| TOTAL — TOP 10 |
81,218 |
53.4 |
— |
| TOTAL — OTHERS |
70,880 |
46,6 |
— |
| GRAND TOTAL |
152,098 |
100 |
— |
| PERMANENT RESIDENTS ADMITTED BY REGION IN 1987 |
| REGION |
NUMBER |
PERCENTAGE |
| Africa and the Middle East |
8,501 |
5.6 |
| Asia and Pacific |
67,337 |
44.3 |
| South America |
10,801 |
7.1 |
| North/Central America |
6,873 |
4.5 |
| Caribbean/Antilles |
11,227 |
7.4 |
| United States |
7,967 |
5.2 |
| Europe and the United Kingdom |
37,563 |
24.7 |
| Others |
1,829 |
1.2 |
| Total |
152,098 |
100 |
| PERMANENT RESIDENTS IN YEAR 1988 |
| SOURCE COUNTRY |
NUMBER |
PERCENTAGE |
RANK |
| Hong Kong |
23,281 |
14.4 |
1 |
| India |
10,409 |
6.4 |
2 |
| Poland |
9,231 |
5.7 |
3 |
| United Kingdom |
9,172 |
5.7 |
4 |
| Philippines |
8,310 |
5.1 |
5 |
| United States |
6,537 |
4.0 |
6 |
| Portugal |
6,467 |
4.0 |
7 |
| Vietnam |
6,196 |
3.8 |
8 |
| Jamaica |
3,923 |
2.4 |
9 |
| Iran |
3,669 |
2.3 |
10 |
| TOTAL — TOP 10 |
87,195 |
53.8 |
— |
| TOTAL — OTHERS |
74,734 |
46.2 |
— |
| GRAND TOTAL |
161,929 |
100 |
— |
| PERMANENT RESIDENTS ADMITTED BY REGION IN 1988 |
| REGION |
NUMBER |
PERCENTAGE |
| Africa and the Middle East |
9,380 |
5.8 |
| Asia and Pacific |
81,136 |
50.1 |
| South America |
7,255 |
4.5 |
| North/Central America |
5,671 |
3.5 |
| Caribbean/Antilles |
9,439 |
5.9 |
| United States |
6,537 |
4.0 |
| Europe and the United Kingdom |
40,689 |
25.1 |
| Others |
1,822 |
1.1 |
| Total |
161,929 |
100 |
| PERMANENT RESIDENTS IN YEAR 1989 |
| SOURCE COUNTRY |
NUMBER |
PERCENTAGE |
RANK |
| Hong Kong |
19,908 |
10.4 |
1 |
| Poland |
15,985 |
8.3 |
2 |
| Philippines |
11,383 |
5.9 |
3 |
| Vietnam |
9,425 |
4.9 |
4 |
| India |
8,819 |
4.6 |
5 |
| United Kingdom |
8,420 |
4.4 |
6 |
| Portugal |
8,189 |
4.3 |
7 |
| United States |
6,931 |
3.6 |
8 |
| Lebanon |
6,179 |
3.2 |
9 |
| China |
4,430 |
2.3 |
10 |
| TOTAL — TOP 10 |
99,679 |
51.9 |
— |
| TOTAL — OTHERS |
92,322 |
48.1 |
— |
| GRAND TOTAL |
193,001 |
100 |
— |
| PERMANENT RESIDENTS ADMITTED BY REGION IN 1989 |
| REGION |
NUMBER |
PERCENTAGE |
| Africa and the Middle East |
12,199 |
6.3 |
| Asia and Pacific |
93,261 |
48.6 |
| South America |
8,685 |
4.5 |
| United States |
6,931 |
3.6 |
| Europe and the United Kingdom |
52,107 |
27.1 |
| North/Central America |
5,870 |
3.1 |
| Caribbean/Antilles |
10,909 |
5.7 |
| Others |
2,041 |
1.1 |
| Total |
193,001 |
100 |
| PERMANENT RESIDENTS IN YEAR 1990 |
| SOURCE COUNTRY |
NUMBER |
PERCENTAGE |
RANK |
| Hong Kong |
29,261 |
13.7 |
1 |
| Poland |
16,579 |
7.7 |
2 |
| Lebanon |
12,462 |
5.8 |
3 |
| Philippines |
12,042 |
5.6 |
4 |
| India |
10,624 |
5.1 |
5 |
| Vietnam |
9,081 |
4.2 |
6 |
| United Kingdom |
8,217 |
3.8 |
7 |
| China |
7,987 |
3.7 |
8 |
| Portugal |
7,917 |
3.7 |
9 |
| United |
6,084 |
2.8 |
10 |
| TOTAL — TOP 10 |
120,256 |
56.1 |
— |
| TOTAL — OTHERS |
93,974 |
43.9 |
— |
| GRAND TOTAL |
214,230 |
100 |
— |
| PERMANENT RESIDENTS ADMITTED BY REGION IN 1990 |
| REGION |
NUMBER |
PERCENTAGE |
| Africa and the Middle East |
13,440 |
6.3 |
| Asia and Pacific |
111,739 |
52.2 |
| South America |
8,898 |
4.2 |
| United States |
6,084 |
2.8 |
| Europe and the United Kingdom |
51,945 |
24.3 |
| North/Central America |
7,781 |
3.6 |
| Caribbean/Antilles |
11,689 |
5.5 |
| Others |
2,654 |
1.2 |
| Total |
214,230 |
100 |
| PERMANENT RESIDENTS IN YEAR 1991 |
| SOURCE COUNTRY |
NUMBER |
PERCENTAGE |
RANK |
| Hong Kong |
22,340 |
9.7 |
1 |
| Poland |
15,731 |
6.8 |
2 |
| China |
13,915 |
6.0 |
3 |
| India |
12,848 |
5.6 |
4 |
| Philippines |
12,335 |
5.3 |
5 |
| Lebanon |
11,987 |
5.2 |
6 |
| Vietnam |
8,963 |
3.9 |
7 |
| United Kingdom |
7,543 |
3.3 |
8 |
| El Salvador |
6,977 |
3.0 |
9 |
| Sri Lanka |
6,826 |
3.0 |
10 |
| TOTAL — TOP 10 |
119,465 |
51.8 |
— |
| TOTAL — OTHERS |
111,316 |
48.2 |
— |
| GRAND TOTAL |
230,781 |
100 |
— |
| PERMANENT RESIDENTS ADMITTED BY REGION IN 1991 |
| REGION |
NUMBER |
PERCENTAGE |
| Africa and the Middle East |
16,087 |
7.0 |
| Asia and Pacific |
119,955 |
52.0 |
| South America |
10,582 |
4.6 |
| United States |
6,597 |
2.9 |
| Europe and the United Kingdom |
48,055 |
20.8 |
| North/Central America |
13,404 |
5.8 |
| Caribbean/Antilles |
12,922 |
5.6 |
| Others |
3,179 |
1.4 |
| Total |
230,781 |
100 |
| PERMANENT RESIDENTS IN YEAR 1992 |
| SOURCE COUNTRY |
NUMBER |
PERCENTAGE |
RANK |
| Hong Kong |
38,910 |
15.4 |
1 |
| Philippines |
13,273 |
5.2 |
2 |
| India |
12,675 |
5.0 |
3 |
| Sri Lanka |
12,635 |
5.0 |
4 |
| Poland |
11,878 |
4.7 |
5 |
| China |
10,429 |
4.1 |
6 |
| Vietnam |
7,681 |
3.2 |
7 |
| United States |
7,537 |
3.0 |
8 |
| Taiwan |
7,456 |
2.9 |
9 |
| United Kingdom |
7,138 |
2.8 |
10 |
| TOTAL — TOP 10 |
129,612 |
51.3 |
— |
| TOTAL — OTHERS |
123,230 |
48.7 |
— |
| GRAND TOTAL |
252,842 |
100 |
— |
| PERMANENT RESIDENTS ADMITTED BY REGION IN 1992 |
| REGION |
NUMBER |
PERCENTAGE |
| Africa and the Middle East |
19,633 |
7.7 |
| Asia and Pacific |
139,216 |
54.4 |
| South America |
10,389 |
4.1 |
| United States |
7,537 |
2.9 |
| Europe and the United Kingdom |
44,871 |
17.5 |
| North/Central America |
12,526 |
4.9 |
| Caribbean/Antilles |
14,952 |
5.8 |
| Others |
3,718 |
1.5 |
| Total |
252,842 |
100 |
| PERMANENT RESIDENTS IN YEAR 1993 |
| SOURCE COUNTRY |
NUMBER |
PERCENTAGE |
RANK |
| Hong Kong |
36,574 |
14.3 |
1 |
| India |
20,472 |
8.0 |
2 |
| Philippines |
19,772 |
7.7 |
3 |
| Taiwan |
9,867 |
3.9 |
4 |
| China |
9,466 |
3.7 |
5 |
| Sri Lanka |
9,103 |
3.6 |
6 |
| Vietnam |
8,301 |
3.2 |
7 |
| United States |
8,014 |
3.1 |
8 |
| United Kingdom |
7,159 |
2.8 |
9 |
| Poland |
6,877 |
2.7 |
10 |
| TOTAL — TOP 10 |
135,605 |
53.0 |
— |
| TOTAL — OTHERS |
120,214 |
47.0 |
— |
| GRAND TOTAL |
255,819 |
100 |
— |
| PERMANENT RESIDENTS ADMITTED BY REGION IN 1993 |
| REGION |
NUMBER |
PERCENTAGE |
| Africa and the Middle East |
16,918 |
6.6 |
| Asia and Pacific |
147,323 |
57.6 |
| South America |
9,580 |
3.7 |
| United States |
8,014 |
3.1 |
| Europe and the United Kingdom |
46,602 |
18.2 |
| North/Central America |
7,737 |
3.0 |
| Caribbean/Antilles |
16,563 |
6.5 |
| Others |
3,082 |
1.2 |
| Total |
255,819 |
100 |
| PERMANENT RESIDENTS IN YEAR 1994 |
| SOURCE COUNTRY |
NUMBER |
PERCENTAGE |
RANK |
| Hong Kong |
44,169 |
19.7 |
1 |
| Philippines |
19,097 |
8.5 |
2 |
| India |
17,225 |
7.7 |
3 |
| China |
12,486 |
5.6 |
4 |
| Taiwan |
7,411 |
3.3 |
5 |
| Sri Lanka |
6,671 |
3.0 |
6 |
| United States |
6,234 |
2.8 |
7 |
| Vietnam |
6,230 |
2.8 |
8 |
| United Kingdom |
5,971 |
2.8 |
9 |
| Bosnia-Hercegovina |
4,905 |
2.2 |
10 |
| TOTAL — TOP 10 |
130,399 |
58.2 |
— |
| TOTAL — OTHERS |
93,476 |
41.8 |
— |
| GRAND TOTAL |
223,875 |
100 |
— |
| PERMANENT RESIDENTS ADMITTED BY REGION IN 1994 |
| REGION |
NUMBER |
PERCENTAGE |
| Africa and the Middle East |
13,706 |
6.1 |
| Asia and Pacific |
141,587 |
63.2 |
| South America |
7,919 |
3.5 |
| United States |
6,234 |
2.8 |
| Europe and the United Kingdom |
38,641 |
17.3 |
| North/Central America |
3,503 |
1.6 |
| Caribbean/Antilles |
9,980 |
4.5 |
| Others |
2,215 |
1.0 |
| Total |
223,875 |
100 |
| PERMANENT RESIDENTS IN YEAR 1995 |
| SOURCE COUNTRY |
NUMBER |
PERCENTAGE |
RANK |
| Hong Kong |
31,746 |
14.9 |
1 |
| India |
16,215 |
7.6 |
2 |
| Philippines |
15,149 |
7.1 |
3 |
| China |
13,291 |
6.3 |
4 |
| Sri Lanka |
8,926 |
4.2 |
5 |
| Taiwan |
7,691 |
3.6 |
6 |
| Bosnia-Hercegovina |
6,270 |
3.0 |
7 |
| United Kingdom |
6,161 |
2.9 |
8 |
| United States |
5,185 |
2.4 |
9 |
| Pakistan |
3,996 |
1.9 |
10 |
| TOTAL — TOP 10 |
114,630 |
53.9 |
— |
| TOTAL — OTHERS |
97,874 |
46.1 |
— |
| GRAND TOTAL |
212,504 |
100 |
— |
| PERMANENT RESIDENTS ADMITTED BY REGION IN 1995 |
| REGION |
NUMBER |
PERCENTAGE |
| Africa and the Middle East |
14,631 |
6.9 |
| Asia and Pacific |
129,106 |
60.8 |
| South America |
7,538 |
3.5 |
| United States |
5,185 |
2.4 |
| Europe and the United Kingdom |
41,266 |
19.4 |
| North/Central America |
2,842 |
1.3 |
| Caribbean/Antilles |
10,056 |
4.5 |
| Others |
1,880 |
0.8 |
| Total |
212,504 |
100 |
| PERMANENT RESIDENTS IN YEAR 1996 |
| SOURCE COUNTRY |
NUMBER |
PERCENTAGE |
RANK |
| Hong Kong |
29,966 |
13.3 |
1 |
| India |
21,276 |
9.4 |
2 |
| China |
17,516 |
7.8 |
3 |
| Taiwan |
13,207 |
5.8 |
4 |
| Philippines |
13,132 |
5.8 |
5 |
| Pakistan |
7,753 |
3.4 |
6 |
| Sri Lanka |
6,151 |
2.7 |
7 |
| United States |
5,837 |
2.6 |
8 |
| Iran |
5,828 |
2.6 |
9 |
| United Kingdom |
5,585 |
2.5 |
10 |
| TOTAL — TOP 10 |
126,251 |
55.9 |
— |
| TOTAL — OTHERS |
99,522 |
44.1 |
— |
| GRAND TOTAL |
225,773 |
100 |
— |
| PERMANENT RESIDENTS ADMITTED BY REGION IN 1996 |
| REGION |
NUMBER |
PERCENTAGE |
| Africa and the Middle East |
36,503 |
16.15 |
| Asia and Pacific |
124,771 |
55.20 |
| South and Central America |
18,878 |
8.35 |
| United States |
5,869 |
2.60 |
| Europe and the United Kingdom |
40,009 |
17.70 |
| Not Stated |
20 |
0.01 |
| Total |
225,773 |
100 |
| PERMANENT RESIDENTS IN YEAR 1997 |
| SOURCE COUNTRY |
NUMBER |
PERCENTAGE |
RANK |
| Hong Kong |
22,242 |
10.30 |
1 |
| India |
19,614 |
9.08 |
2 |
| China |
18,530 |
8.58 |
3 |
| Taiwan |
13,321 |
6.17 |
4 |
| Pakistan |
11,233 |
5.20 |
5 |
| Philippines |
10,873 |
5.03 |
6 |
| Iran |
7,477 |
3.46 |
7 |
| Sri Lanka |
5,069 |
2.35 |
8 |
| United States |
5,043 |
2.33 |
9 |
| United Kingdom |
4,659 |
2.16 |
10 |
| TOTAL — TOP 10 |
118,061 |
54.65 |
— |
| TOTAL — OTHERS |
97,983 |
45.35 |
— |
| GRAND TOTAL |
216,044 |
100 |
— |
| PERMANENT RESIDENTS ADMITTED BY REGION IN 1997 |
| REGION |
NUMBER |
PERCENTAGE |
| Africa and the Middle East |
37,794 |
17.49 |
| Asia and Pacific |
117,076 |
54.19 |
| South and Central America |
17,425 |
8.07 |
| United States |
5,043 |
2.33 |
| Europe and the United Kingdom |
38,673 |
17.90 |
| Not Stated |
33 |
0.02 |
| Total |
216,044 |
100 |
| PERMANENT RESIDENTS IN YEAR 1998 |
| SOURCE COUNTRY |
NUMBER |
PERCENTAGE |
RANK |
| China |
19,749 |
11.34 |
1 |
| India |
11.34 |
8.80 |
2 |
| Philippines |
8,172 |
4.69 |
3 |
| Hong Kong |
8,083 |
4.64 |
4 |
| Pakistan |
8,081 |
4.64 |
5 |
| Taiwan |
7,164 |
4.11 |
6 |
| Iran |
6,772 |
3.89 |
7 |
| South Korea |
4,910 |
2.82 |
8 |
| United States |
4,764 |
2.74 |
9 |
| Russia |
4,299 |
2.47 |
10 |
| TOTAL — TOP 10 |
87,321 |
50.16 |
— |
| TOTAL — OTHERS |
86,779 |
49.84 |
— |
| GRAND TOTAL |
174,100 |
100 |
— |
| PERMANENT RESIDENTS ADMITTED BY REGION IN 1998 |
| REGION |
NUMBER |
PERCENTAGE |
| Africa and the Middle East |
32,534 |
18.69 |
| Asia and Pacific |
84,036 |
48.27 |
| South and Central America |
14,003 |
8.04 |
| United States |
4,764 |
2.74 |
| Europe and the United Kingdom |
38,477 |
22.10 |
| Not Stated |
286 |
0.16 |
| Total |
174,100 |
100 |
| PERMANENT RESIDENTS IN YEAR 1999 |
| SOURCE COUNTRY |
NUMBER |
PERCENTAGE |
RANK |
| China |
29,095 |
15.33 |
1 |
| India |
17,415 |
9.17 |
2 |
| Pakistan |
9,285 |
4.89 |
3 |
| Philippines |
9,285 |
4.89 |
4 |
| South Korea |
7,212 |
3.80 |
5 |
| Iran |
5,903 |
3.11 |
6 |
| United States |
5,514 |
2.90 |
7 |
| Taiwan |
5,461 |
2.88 |
8 |
| Sri Lanka |
4,719 |
2.49 |
9 |
| United Kingdom |
4,476 |
2.36 |
10 |
| TOTAL — TOP 10 |
98,240 |
51.76 |
— |
| TOTAL — OTHERS |
91,576 |
48.24 |
— |
| GRAND TOTAL |
189,816 |
100 |
— |
| PERMANENT RESIDENTS ADMITTED BY REGION IN 1999 |
| REGION |
NUMBER |
PERCENTAGE |
| Africa and the Middle East |
33,441 |
17.62 |
| Asia and Pacific |
96,370 |
50.77 |
| South and Central America |
15,188 |
8.00 |
| United States |
5,514 |
2.90 |
| Europe and the United Kingdom |
38,912 |
20.50 |
| Not Stated |
391 |
0.21 |
| Total |
189,816 |
100 |
| PERMANENT RESIDENTS IN YEAR 2000 |
| SOURCE COUNTRY |
NUMBER |
PERCENTAGE |
RANK |
| China |
36,715 |
16.15 |
1 |
| India |
26,086 |
11.48 |
2 |
| Pakistan |
14,182 |
6.24 |
3 |
| Philippines |
10,086 |
4.44 |
4 |
| South Korea |
7,626 |
3.35 |
5 |
| Sri Lanka |
5,841 |
2.57 |
6 |
| United States |
5,814 |
2.56 |
7 |
| Iran |
5,608 |
2.47 |
8 |
| Yugoslavia |
4,723 |
2.08 |
9 |
| United Kingdom |
4,647 |
2.04 |
10 |
| TOTAL — TOP 10 |
121,328 |
53.38 |
— |
| TOTAL — OTHERS |
105,985 |
46.62 |
— |
| GRAND TOTAL |
227,313 |
100 |
— |
| PERMANENT RESIDENTS ADMITTED BY REGION IN 2000 |
| REGION |
NUMBER |
PERCENTAGE |
| Africa and the Middle East |
40,815 |
17.96 |
| Asia and Pacific |
120,539 |
53.03 |
| South and Central America |
16,944 |
7.45 |
| United States |
5,814 |
2.56 |
| Europe and the United Kingdom |
42,885 |
18.87 |
| Not Stated |
316 |
0.14 |
| Total |
227,313 |
100 |
| PERMANENT RESIDENTS IN YEAR 2001 |
| SOURCE COUNTRY |
NUMBER |
PERCENTAGE |
RANK |
| China |
40,315 |
16.09 |
1 |
| India |
27,848 |
11.12 |
2 |
| Pakistan |
15,341 |
6.12 |
3 |
| Philippines |
12,914 |
5.16 |
4 |
| South Korea |
9,604 |
3.83 |
5 |
| United States |
5,902 |
2.36 |
6 |
| Iran |
5,737 |
2.29 |
7 |
| Romania |
5,585 |
2.23 |
8 |
| Sri Lanka |
5,514 |
2.20 |
9 |
| United Kingdom |
5,350 |
2.14 |
10 |
| TOTAL — TOP 10 |
134,110 |
53.54 |
— |
| TOTAL — OTHERS |
116,374 |
46.46 |
— |
| GRAND TOTAL |
250,484 |
100 |
— |
| PERMANENT RESIDENTS ADMITTED BY REGION IN 2001 |
| REGION |
NUMBER |
PERCENTAGE |
| Africa and the Middle East |
48,078 |
19.20 |
| Asia and Pacific |
132,711 |
53.01 |
| South and Central America |
20,129 |
8.04 |
| United States |
5,894 |
2.35 |
| Europe and the United Kingdom |
43,204 |
17.26 |
| Not Stated |
330 |
0.13 |
| Total |
250,346 |
100 |
| PERMANENT RESIDENTS IN YEAR 2002 |
| SOURCE COUNTRY |
NUMBER |
PERCENTAGE |
RANK |
| China |
33,231 |
14.51 |
1 |
| India |
28,815 |
12.58 |
2 |
| Pakistan |
14,164 |
6.18 |
3 |
| Philippines |
11,000 |
4.80 |
4 |
| Iran |
7,742 |
3.38 |
5 |
| South Korea |
7,326 |
3.20 |
6 |
| Romania |
5,692 |
2.48 |
7 |
| United States |
5,288 |
2.31 |
8 |
| Sri Lanka |
4,961 |
2.17 |
9 |
| United Kingdom |
4,720 |
2.06 |
10 |
| TOTAL — TOP 10 |
122,939 |
53.67 |
— |
| TOTAL — OTHERS |
106,152 |
46.33 |
— |
| GRAND TOTAL |
229,091 |
100 |
— |
| PERMANENT RESIDENTS ADMITTED BY REGION IN 2002 |
| REGION |
NUMBER |
PERCENTAGE |
| Africa and the Middle East |
46,113 |
20.13 |
| Asia and Pacific |
118,899 |
51.90 |
| South and Central America |
19,417 |
8.48 |
| United States |
5,288 |
2.31 |
| Europe and the United Kingdom |
38,841 |
16.95 |
| Not Stated |
533 |
0.23 |
| Total |
229,091 |
100 |
https://publications.gc.ca/site/eng/9.505817/publication.html
Source for 1995/1996:
Source for 1996-1998
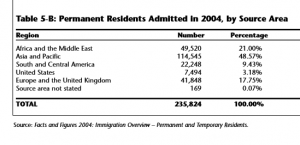
(Page 18 of the 2004 Annual Report to Parliament)
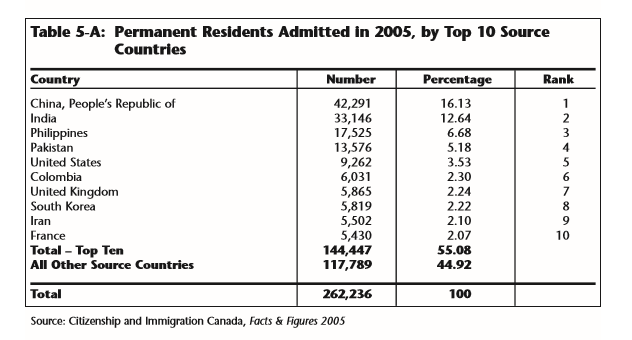
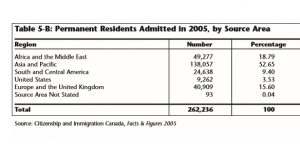
(Page 24 of the 2005 Annual Report to Parliament)
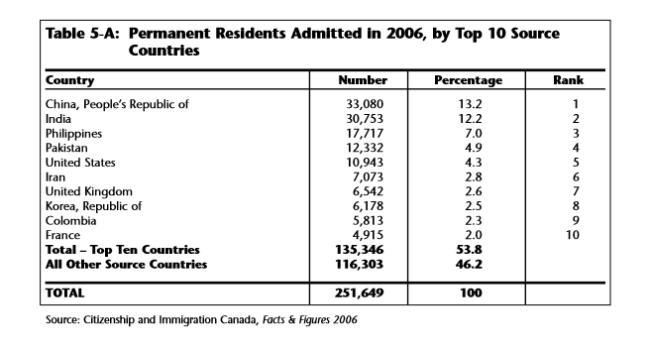
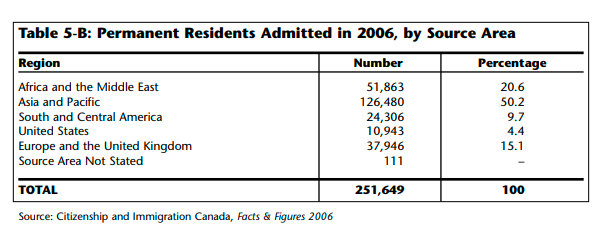
(Page 18, 19 of the 2006 Annual Report to Parliament)
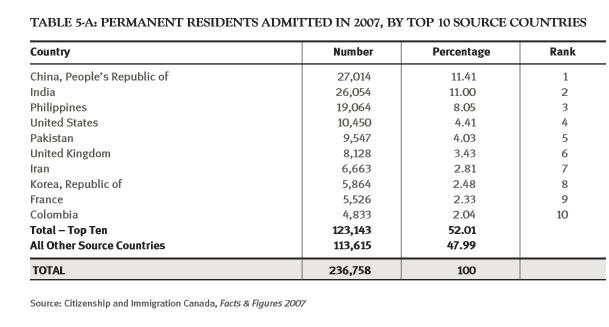
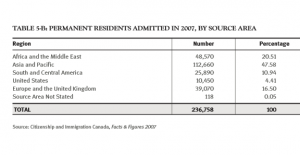
(Page 19, 20 of the 2007 Annual Report to Parliament)
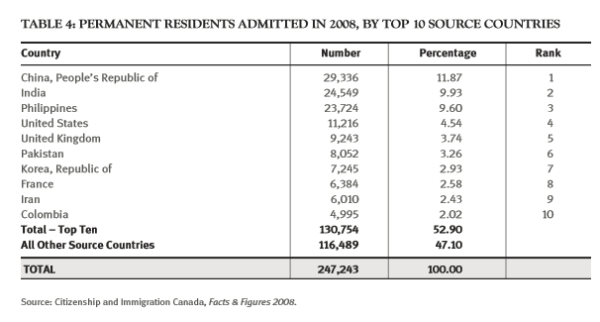
(Page 21, 22 of the 2008 Annual Report to Parliament)
(Page 16 of the 2009 Annual Report to Parliament)
| PERMANENT RESIDENTS ADMITTED BY REGION IN 2008 |
| REGION |
NUMBER |
PERCENTAGE |
| Africa and the Middle East |
51,313 |
20.8 |
| Asia and Pacific |
117,480 |
47.5 |
| South and Central America |
26,493 |
10.7 |
| United States |
11,216 |
4.5 |
| Europe and the United Kingdom |
40,649 |
16.4 |
| Not Stated |
96 |
0.0 |
| Total |
247,247 |
100 |
(Page 14 of the 2010 Annual Report to Parliament)
| PERMANENT RESIDENTS ADMITTED BY REGION IN 2009 |
| REGION |
NUMBER |
PERCENTAGE |
| Africa and the Middle East |
56,151 |
22.2 |
| Asia and Pacific |
117,174 |
46.5 |
| South and Central America |
26,776 |
10.6 |
| United States |
9,723 |
3.9 |
| Europe and the United Kingdom |
42,311 |
16.8 |
| Not Stated |
37 |
0.0 |
| Total |
252,172 |
100 |
(Page 18 of the 2011 Annual Report to Parliament)
| PERMANENT RESIDENTS ADMITTED BY REGION IN 2010 |
| REGION |
NUMBER |
PERCENTAGE |
| Africa and the Middle East |
66,692 |
23.8 |
| Asia and Pacific |
135,008 |
48.1 |
| South and Central America |
28,357 |
10.1 |
| United States |
9,242 |
3.3 |
| Europe and the United Kingdom |
41,317 |
14.7 |
| Not Stated |
73 |
0.0 |
| Total |
280,689 |
100 |
(Page 15 of the 2012 Annual Report to Parliament)
| PERMANENT RESIDENTS ADMITTED BY REGION IN 2011 |
| REGION |
NUMBER |
PERCENTAGE |
| Africa and the Middle East |
59,323 |
23.8 |
| Asia and Pacific |
120,330 |
48.4 |
| South and Central America |
27,447 |
11.0 |
| United States |
8,830 |
3.5 |
| Europe and the United Kingdom |
32,755 |
13.2 |
| Not Stated |
63 |
0.0 |
| Total |
248,748 |
100 |
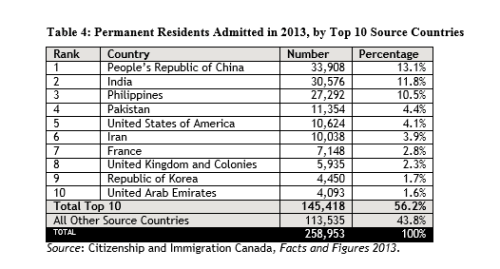
(Page 19 of the 2013 Annual Report to Parliament)
| PERMANENT RESIDENTS ADMITTED BY REGION IN 2012 |
| REGION |
NUMBER |
PERCENTAGE |
| Africa and the Middle East |
56,060 |
21.7 |
| Asia and Pacific |
129,592 |
50.3 |
| South and Central America |
26,864 |
10.4 |
| United States |
9,414 |
3.7 |
| Europe and the United Kingdom |
35,828 |
13.9 |
| Not Stated |
129 |
0.0 |
| Total |
257,887 |
100 |
(Page 16 of the 2014 Annual Report to Parliament)
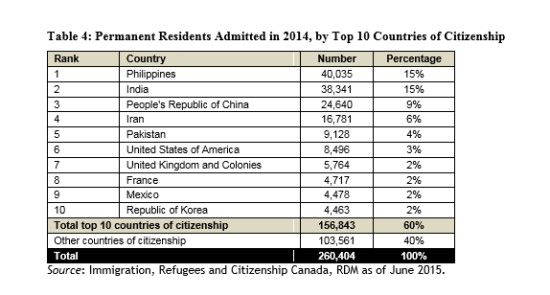
(Page 16 of the 2015 Annual Report to Parliament)
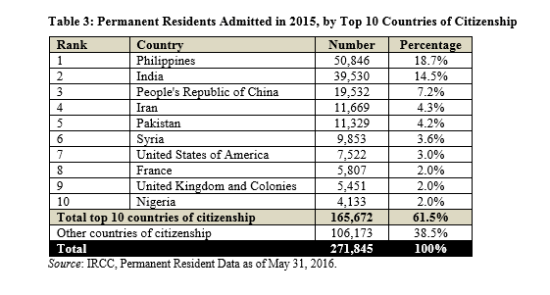
(Page 10 of the 2016 Annual Report to Parliament)
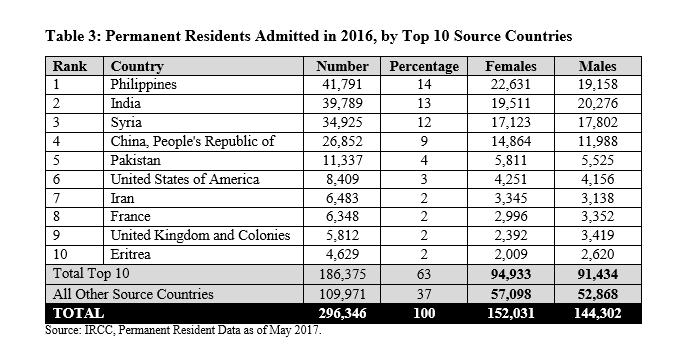
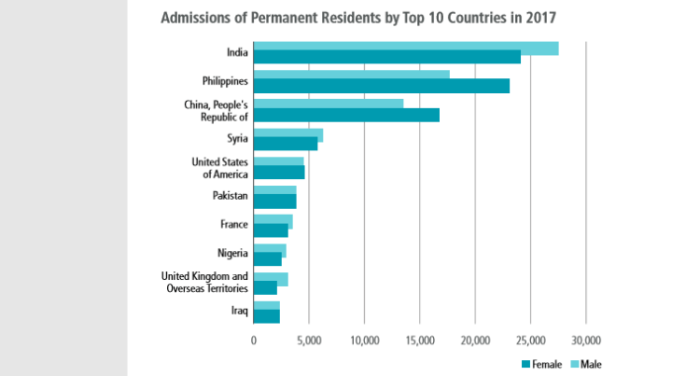
(Page 14 of the 2017 Annual Report to Parliament)
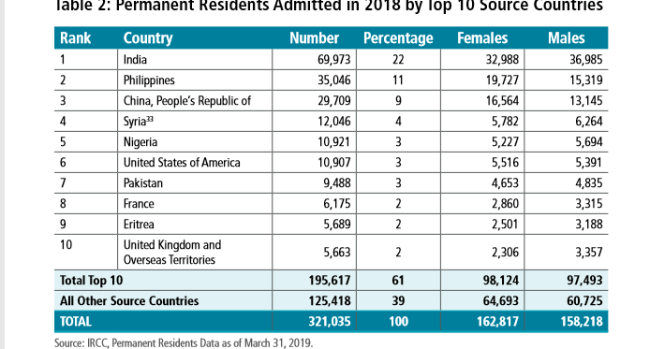
(Page 28 of the 2018 Annual Report to Parliament)
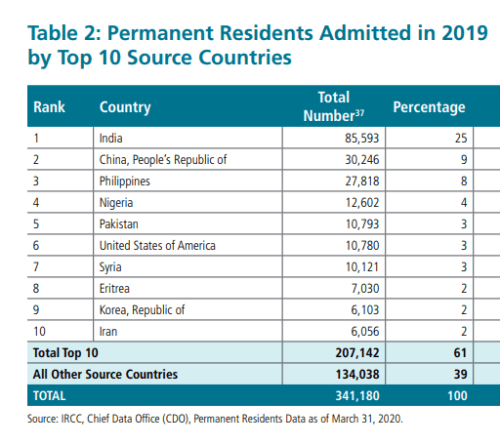
(Page 36 of the 2019 Annual Report to Parliament)
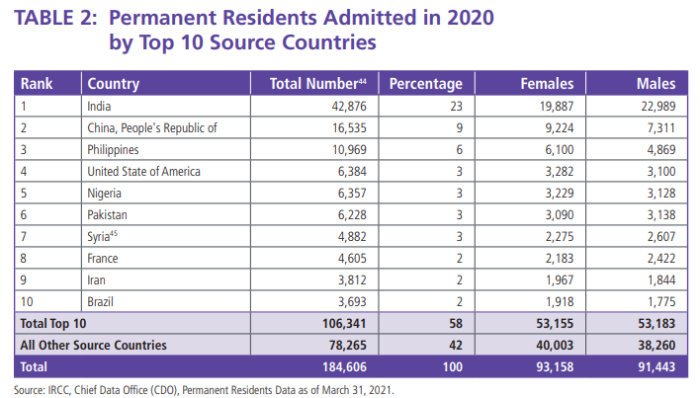
(Page 33 of the 2020 Annual Report to Parliament)
(Page 36 of the 2021 Annual Report to Parliament)
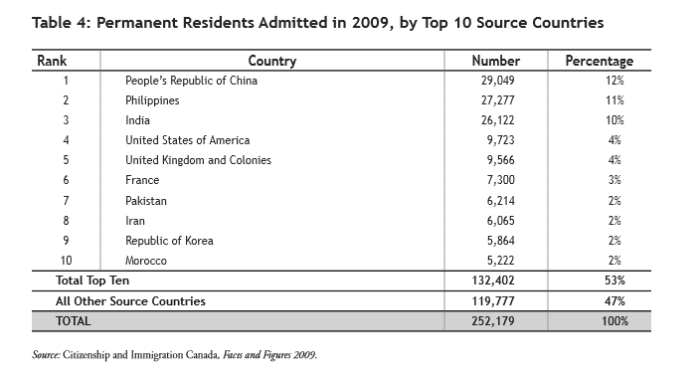
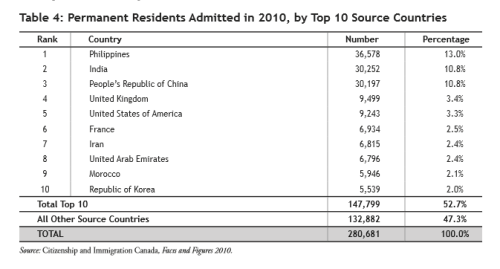
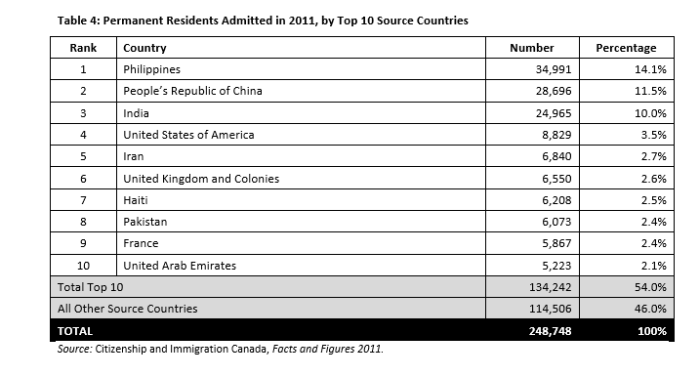
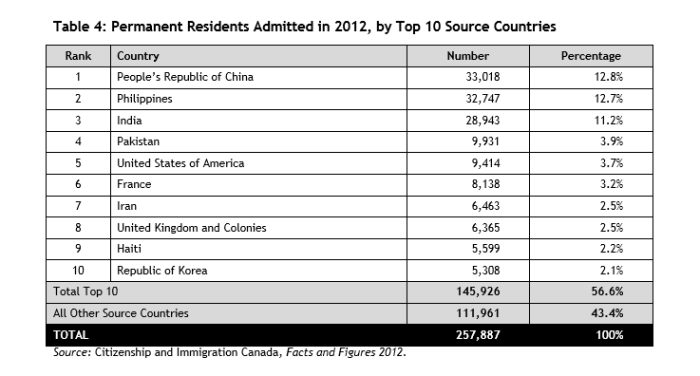
Are things starting to make sense? Immigration policies for the last 50+ years have focused on Asians and Africans, replacing (to a large degree) the overwhelmingly European makeup that was Canada for many years.
Of course, speaking up about what’s apparent will lead to cries of racism.


One thing people really need to get clear: so-called “conservatives” have no interest whatsoever in preserving demographics or the makeup of a country. They fully support the genocide agenda, but try to pitch it from a more economic perspective.
White replacement is a very real thing. Only the most obtuse or unobservant cannot see what’s going on, especially given how blatant it is..
While Liberals are generally quite open for their disdain of Europeans, “Conservatives” behave in a stealthier and more subversive manner. They camouflage their true intentions, making them more dangerous.
A little self promotion: Borderless Canada is still available online. Learn about what’s been going on in this country. Virtually all major issues can be directly tied to immigration and border security, and it’s not racist or bigoted to discuss these hard truths.
4. Documents Provided By Canadian Government
(A.0) https://epe.lac-bac.gc.ca/100/202/301/immigration_statistics-ef/index.html
(A.1) https://epe.lac-bac.gc.ca/100/202/301/immigration_statistics-ef/mp22-1_1966.pdf
Canada Immigration Statistics 1966
(A.2) https://epe.lac-bac.gc.ca/100/202/301/immigration_statistics-ef/mp22-1_1967.pdf
Canada Immigration Statistics 1967
(A.3) https://epe.lac-bac.gc.ca/100/202/301/immigration_statistics-ef/mp22-1_1968.pdf
Canada Immigration Statistics 1968
(A.4) https://epe.lac-bac.gc.ca/100/202/301/immigration_statistics-ef/mp22-1_1969.pdf
Canada Immigration Statistics 1969
(A.5) https://epe.lac-bac.gc.ca/100/202/301/immigration_statistics-ef/mp22-1_1970.pdf
Canada Immigration Statistics 1970
(A.6) https://epe.lac-bac.gc.ca/100/202/301/immigration_statistics-ef/mp22-1_1971.pdf
Canada Immigration Statistics 1971
(A.7) https://epe.lac-bac.gc.ca/100/202/301/immigration_statistics-ef/mp22-1_1972.pdf
Canada Immigration Statistics 1972
(A.8) https://epe.lac-bac.gc.ca/100/202/301/immigration_statistics-ef/mp22-1_1973.pdf
Canada Immigration Statistics 1973
(A.9) https://epe.lac-bac.gc.ca/100/202/301/immigration_statistics-ef/mp22-1_1974.pdf
Canada Immigration Statistics 1974
(A.10) https://epe.lac-bac.gc.ca/100/202/301/immigration_statistics-ef/mp22-1_1975.pdf
Canada Immigration Statistics 1975
(A.11) https://epe.lac-bac.gc.ca/100/202/301/immigration_statistics-ef/mp22-1_1976.pdf
Canada Immigration Statistics 1976
(A.12) https://epe.lac-bac.gc.ca/100/202/301/immigration_statistics-ef/mp22-1_1977.pdf
Canada Immigration Statistics 1977
(A.13) https://epe.lac-bac.gc.ca/100/202/301/immigration_statistics-ef/mp22-1_1978.pdf
Canada Immigration Statistics 1978
(A.14) https://epe.lac-bac.gc.ca/100/202/301/immigration_statistics-ef/mp22-1_1979.pdf
Canada Immigration Statistics 1979
(A.15) https://epe.lac-bac.gc.ca/100/202/301/immigration_statistics-ef/mp22-1_1980.pdf
Canada Immigration Statistics 1980
(A.16) https://epe.lac-bac.gc.ca/100/202/301/immigration_statistics-ef/mp22-1_1981.pdf
Canada Immigration Statistics 1981
(A.17) https://epe.lac-bac.gc.ca/100/202/301/immigration_statistics-ef/mp22-1_1982.pdf
Canada Immigration Statistics 1982
(A.18) https://epe.lac-bac.gc.ca/100/202/301/immigration_statistics-ef/mp22-1_1983.pdf
Canada Immigration Statistics 1983
(A.19) https://epe.lac-bac.gc.ca/100/202/301/immigration_statistics-ef/mp22-1_1984.pdf
Canada Immigration Statistics 1984
(A.20) https://epe.lac-bac.gc.ca/100/202/301/immigration_statistics-ef/mp22-1_1985.pdf
Canada Immigration Statistics 1985
(A.21) https://epe.lac-bac.gc.ca/100/202/301/immigration_statistics-ef/mp22-1_1986.pdf
Canada Immigration Statistics 1986
(A.22) https://epe.lac-bac.gc.ca/100/202/301/immigration_statistics-ef/mp22-1_1987.pdf
Canada Immigration Statistics 1987
(A.23) https://epe.lac-bac.gc.ca/100/202/301/immigration_statistics-ef/mp22-1_1988.pdf
Canada Immigration Statistics 1988
(A.24) https://epe.lac-bac.gc.ca/100/202/301/immigration_statistics-ef/mp22-1_1989.pdf
Canada Immigration Statistics 1989
(A.25) https://epe.lac-bac.gc.ca/100/202/301/immigration_statistics-ef/mp22-1_1990.pdf
Canada Immigration Statistics 1990
(A.26) https://epe.lac-bac.gc.ca/100/202/301/immigration_statistics-ef/mp22-1_1991.pdf
Canada Immigration Statistics 1991
(A.27) https://epe.lac-bac.gc.ca/100/202/301/immigration_statistics-ef/mp22-1_1992.pdf
Canada Immigration Statistics 1992
(A.28) https://epe.lac-bac.gc.ca/100/202/301/immigration_statistics-ef/mp22-1_1993.pdf
Canada Immigration Statistics 1993
(A.29) https://epe.lac-bac.gc.ca/100/202/301/immigration_statistics-ef/mp22-1_1994.pdf
Canada Immigration Statistics 1994
(A.30) https://epe.lac-bac.gc.ca/100/202/301/immigration_statistics-ef/mp22-1_1995.pdf
Canada Immigration Statistics 1995
(A.31) https://epe.lac-bac.gc.ca/100/202/301/immigration_statistics-ef/mp22-1_1996.pdf
Canada Immigration Statistics 1996
(B.0) https://publications.gc.ca/site/eng/9.505817/publication.html
https://www.canada.ca/en/immigration-refugees-citizenship/corporate/reports-statistics/statistics-open-data.html
(B.1) https://publications.gc.ca/collections/collection_2010/cic/MP43-333-1999-eng.pdf
Canada Immigration Facts And Figures 1998
(B.2) https://publications.gc.ca/collections/Collection/MP43-333-2000E.pdf
(B.3) https://publications.gc.ca/collections/Collection/MP43-333-2002E.pdf
(B.4) https://publications.gc.ca/collections/collection_2010/cic/Ci1-8-2003-eng.pdf
(B.5) https://publications.gc.ca/collections/Collection/Ci1-8-2004E.pdf
(B.6) https://publications.gc.ca/collections/Collection/Ci1-8-2005E.pdf
(B.7) https://publications.gc.ca/collections/collection_2009/cic/Ci1-8-2006E.pdf
(B.8) https://publications.gc.ca/collections/collection_2009/cic/Ci1-8-2007E.pdf
(B.9) https://publications.gc.ca/collections/collection_2009/cic/Ci1-8-2008E.pdf
(B.10) https://publications.gc.ca/collections/collection_2010/cic/Ci1-8-2009-eng.pdf
(B.11) https://publications.gc.ca/collections/collection_2011/cic/Ci1-8-2010-eng.pdf
(B.12) https://publications.gc.ca/collections/collection_2013/cic/Ci1-8-2011-eng.pdf
(B.13) https://publications.gc.ca/collections/collection_2013/cic/Ci1-8-2012-eng.pdf
(B.14) https://publications.gc.ca/collections/collection_2015/cic/Ci1-8-9-2013-eng.pdf
(B.15) https://publications.gc.ca/collections/collection_2015/cic/Ci1-8-9-2014-eng.pdf
(C.0) Parliament Report Index
http://archive.is/vwM6G
(C.1) 2004 Report to Canadian Parliament
2004.annual.immigration.report.to.parliament
(C.2) 2005 Report to Canadian Parliament
2005.annual.immigration.report.to.parliament
(C.3) 2006 Report to Canadian Parliament
2006.annual.immigration.report.to.parliament
(C.4) 2007 Report to Canadian Parliament
2007.annual.immigration.report.to.parliament
(C.5) 2008 Report to Canadian Parliament
2008.annual.immigration.report.to.parliament
(C.6) 2009 report to Canadian Parliament
2009.annual.immigration.report.to.parliament
(C.7) 2010 Report to Canadian Parliament
2010.annual.immigration.report.to.parliament
(C.8) 2011 Report to Canadian Parliament
2011.annual.immigration.report.to.parliament
(C.9) 2012 Report to Canadian Parliament
2012.annual.immigration.report.to.parliament
(C.10) 2013 Report to Canadian Parliament
2013.annual.immigration.report.to.parliament
(C.11) 2014 Report to Canadian Parliament
2014.annual.immigration.report.to.parliament
(C.12) 2015 Report to Canadian Parliament
2015.annual.immigration.report.to.parliament
(C.13) 2016 Report to Canadian Parliament
2016.annual.immigration.report.to.parliament
(C.14) 2017 Report to Canadian Parliament
2017.annual.immigration.report.to.parliament
(C.15) 2018 Report to CDN Parliament
2018.annual.immigration.report.to.parliament
(C.15.2) 2019-2021 Supplemental Report
http://archive.is/onyev
(C.16) 2019 Report to Canadian Parliament
2019.annual.immigration.report.to.parliament
(C.17) 2020 Report to Canadian Parliament
2020.annual.immigration.report.to.parliament
(C.18) 2021 Report to Canadian Parliament
2021.annual.immigration.report.to.parliament
Like this:
Like Loading...