
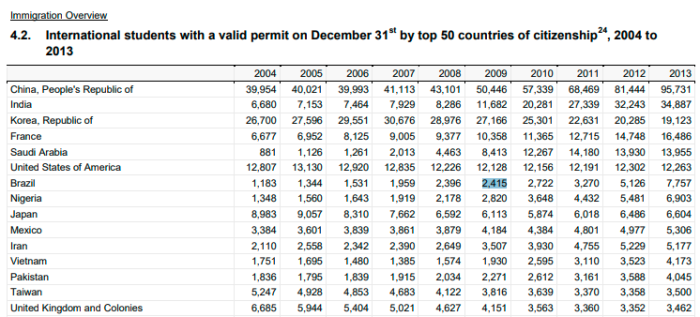
Ever wonder how many international students are in Canada, and where they come from? Well, we have some data available, courtesy of the Federal Government. Let’s take a look at this troubling pattern.
The replacement agenda (a.k.a. the Kalergi Plan) is alive and well. And flooding the country with students from abroad is just one way to help implement it. Colleges and universities get much needed cash, and students get access to life in the West.
One thing to note: it appears that the data from these tables, page 44, refers to the TOTAL number of international students within Canada. This is not the same as the number of visas issued annually.
| SOURCE COUNTRY | NUMBER | PERCENTAGE | RANK |
|---|---|---|---|
| China | 39,954 | 23.7 | 1 |
| South Korea | 26,700 | 15.8 | 2 |
| United States | 12,807 | 7.6 | 3 |
| Japan | 8,983 | 5.3 | 4 |
| United Kingdom, Colonies | 6,685 | 4.0 | 5 |
| India | 6,680 | 4.0 | 6 |
| France | 6,677 | 4.0 | 7 |
| Taiwan | 5,247 | 3.1 | 8 |
| Mexico | 3,384 | 2.0 | 9 |
| Germany | 2,294 | 1.4 | 10 |
| Iran | 2,110 | 1.4 | 11 |
| Hong Kong | 1,993 | 1.2 | 12 |
| Pakistan | 1,836 | 1.1 | 13 |
| Vietnam | 1,751 | 1.0 | 14 |
| Bangladesh | 1,731 | 1.0 | 15 |
| TOTAL — TOP 15 | 122,147 | 72.4 | — |
| TOTAL — OTHERS | 46,492 | 27.6 | — |
| GRAND TOTAL | 168,639 | 100 | — |
| SOURCE COUNTRY | NUMBER | PERCENTAGE | RANK |
|---|---|---|---|
| China | 40,021 | 23.5 | 1 |
| South Korea | 27,596 | 16.2 | 2 |
| United States | 13,130 | 7.7 | 3 |
| Japan | 9,057 | 5.3 | 4 |
| India | 7,153 | 4.2 | 5 |
| France | 6,952 | 4.1 | 6 |
| United Kingdom, Colonies | 5,944 | 3.5 | 7 |
| Taiwan | 4,928 | 2.9 | 8 |
| Mexico | 3,601 | 2.1 | 9 |
| Iran | 2,558 | 1.5 | 10 |
| Germany | 2,462 | 1.4 | 11 |
| Hong Kong | 2,397 | 1.4 | 12 |
| Pakistan | 1,795 | 1.1 | 13 |
| Bangladesh | 1,718 | 1.0 | 14 |
| Vietnam | 1,695 | 1.0 | 15 |
| TOTAL — TOP 15 | 131,007 | 76.9 | — |
| TOTAL — OTHERS | 39,461 | 23.1 | — |
| GRAND TOTAL | 170,468 | 100 | — |
| SOURCE COUNTRY | NUMBER | PERCENTAGE | RANK |
|---|---|---|---|
| China | 39,993 | 23.2 | 1 |
| South Korea | 29,551 | 17.1 | 2 |
| United States | 12,920 | 7.5 | 3 |
| Japan | 8,310 | 4.8 | 4 |
| France | 8,125 | 4.7 | 5 |
| India | 7,464 | 4.3 | 6 |
| United Kingdom, Colonies | 5,404 | 3.1 | 7 |
| Taiwan | 4,853 | 2.8 | 8 |
| Mexico | 3,839 | 2.2 | 9 |
| Hong Kong | 2,663 | 1.5 | 10 |
| Germany | 2,588 | 1.5 | 11 |
| Iran | 2,342 | 1.4 | 12 |
| Pakistan | 1,839 | 1.1 | 13 |
| Morocco | 1,723 | 1.0 | 14 |
| Bangladesh | 1,651 | 0.9 | 15 |
| TOTAL — TOP 15 | 133,265 | 77.3 | — |
| TOTAL — OTHERS | 39,110 | 22.7 | — |
| GRAND TOTAL | 172,375 | 100 | — |
| SOURCE COUNTRY | NUMBER | PERCENTAGE | RANK |
|---|---|---|---|
| China | 41,113 | 22.9 | 1 |
| South Korea | 30,676 | 17.1 | 2 |
| United States | 12,835 | 7.2 | 3 |
| France | 9,005 | 5.0 | 4 |
| India | 7,929 | 4.4 | 5 |
| Japan | 7,662 | 4.3 | 6 |
| United Kingdom, Colonies | 5,021 | 2.8 | 7 |
| Taiwan | 4,683 | 2.6 | 8 |
| Mexico | 3,861 | 2.2 | 9 |
| Germany | 2,947 | 1.6 | 10 |
| Hong Kong | 2,812 | 1.5 | 11 |
| Iran | 2,390 | 1.3 | 12 |
| Brazil | 1,959 | 1.1 | 13 |
| Morocco | 1,930 | 1.1 | 14 |
| Nigeria | 1,919 | 1.1 | 15 |
| TOTAL — TOP 15 | 136,742 | 76.3 | — |
| TOTAL — OTHERS | 42,413 | 23.7 | — |
| GRAND TOTAL | 179,155 | 100 | — |
| SOURCE COUNTRY | NUMBER | PERCENTAGE | RANK |
|---|---|---|---|
| China | 43,101 | 23.4 | 1 |
| South Korea | 28,976 | 15.7 | 2 |
| United States | 12,226 | 6.6 | 3 |
| France | 9,377 | 5.1 | 4 |
| India | 8,286 | 4.5 | 5 |
| Japan | 6,592 | 3.6 | 6 |
| United Kingdom | 4,627 | 2.5 | 7 |
| Saudi Arabia | 4,463 | 2.4 | 8 |
| Taiwan | 4,122 | 2.2 | 9 |
| Mexico | 3,879 | 2.1 | 10 |
| Germany | 3,141 | 1.7 | 11 |
| Hong Kong | 2,912 | 1.6 | 12 |
| Iran | 2,649 | 1.4 | 13 |
| Brazil | 2,396 | 1.3 | 14 |
| Nigeria | 2,178 | 1.2 | 15 |
| TOTAL — TOP 15 | 138,925 | 75.4 | — |
| TOTAL — OTHERS | 45,254 | 24.6 | — |
| GRAND TOTAL | 184,179 | 100 | — |
| SOURCE COUNTRY | NUMBER | PERCENTAGE | RANK |
|---|---|---|---|
| China | 50,446 | 24.7 | 1 |
| South Korea | 27,166 | 13.3 | 2 |
| United States | 12,128 | 5.9 | 3 |
| India | 11,682 | 5.7 | 4 |
| France | 10,358 | 5.1 | 5 |
| Saudi Arabia | 8,413 | 4.1 | 6 |
| Japan | 6,113 | 3.0 | 7 |
| Mexico | 4,184 | 2.1 | 8 |
| United Kingdom, Colonies | 4,151 | 2.0 | 9 |
| Taiwan | 3,816 | 1.9 | 10 |
| Iran | 3,507 | 1.7 | 11 |
| Germany | 3,102 | 1.5 | 12 |
| Hong Kong | 2,956 | 1.4 | 13 |
| Nigeria | 2,820 | 1.4 | 14 |
| Brazil | 2,415 | 1.2 | 15 |
| TOTAL — TOP 15 | 153,257 | 75.1 | — |
| TOTAL — OTHERS | 50,795 | 24.9 | — |
| GRAND TOTAL | 204,052 | 100 | — |
| SOURCE COUNTRY | NUMBER | PERCENTAGE | RANK |
|---|---|---|---|
| China | 57,339 | 25.4 | 1 |
| South Korea | 25,301 | 11.2 | 2 |
| India | 20,281 | 9.0 | 3 |
| Saudi Arabia | 12,267 | 5.4 | 4 |
| United States | 12,156 | 5.4 | 5 |
| France | 11,365 | 5.0 | 6 |
| Japan | 5,874 | 2.6 | 7 |
| Mexico | 4,384 | 1.9 | 8 |
| Iran | 3,930 | 1.7 | 9 |
| Nigeria | 3,648 | 1.6 | 10 |
| Taiwan | 3,639 | 1.6 | 11 |
| United Kingdom, Colonies | 3,563 | 1.5 | 12 |
| Germany | 3,142 | 1.4 | 13 |
| Hong Kong | 2,864 | 1.3 | 14 |
| Brazil | 2,722 | 1.2 | 15 |
| TOTAL — TOP 15 | 172,475 | 76.5 | — |
| TOTAL — OTHERS | 52,920 | 23.5 | — |
| GRAND TOTAL | 225,395 | 100 | — |
| SOURCE COUNTRY | NUMBER | PERCENTAGE | RANK |
|---|---|---|---|
| China | 68,469 | 27.5 | 1 |
| India | 27,339 | 11.0 | 2 |
| South Korea | 22,631 | 9.1 | 3 |
| Saudi Arabia | 14,180 | 5.7 | 4 |
| France | 12,715 | 5.1 | 5 |
| United States | 12,191 | 4.9 | 6 |
| Japan | 6,018 | 2.4 | 7 |
| Mexico | 4,801 | 1.9 | 8 |
| Iran | 4,755 | 1.9 | 9 |
| Nigeria | 4,432 | 1.8 | 10 |
| Taiwan | 3,370 | 1.4 | 11 |
| United Kingdom, Colonies | 3,360 | 1.4 | 12 |
| Brazil | 3,270 | 1.3 | 13 |
| Pakistan | 3,161 | 1.3 | 14 |
| Vietnam | 3,110 | 1.3 | 15 |
| TOTAL — TOP 15 | 190,432 | 76.5 | — |
| TOTAL — OTHERS | 58,395 | 23.5 | — |
| GRAND TOTAL | 248,827 | 100 | — |
| SOURCE COUNTRY | NUMBER | PERCENTAGE | RANK |
|---|---|---|---|
| China | 81,444 | 29.5 | 1 |
| India | 32,243 | 11.7 | 2 |
| South Korea | 20,285 | 7.4 | 3 |
| France | 14,748 | 5.3 | 4 |
| Saudi Arabia | 13,930 | 5.0 | 5 |
| United States | 12,302 | 4.5 | 6 |
| Japan | 6,486 | 2.4 | 7 |
| Nigeria | 5,481 | 2.0 | 8 |
| Iran | 5,229 | 1.9 | 9 |
| Brazil | 5,126 | 1.8 | 10 |
| Mexio | 4,977 | 1.8 | 11 |
| Pakistan | 3,588 | 1.3 | 12 |
| Vietnam | 3,523 | 1.3 | 13 |
| Taiwan | 3,358 | 1.2 | 14 |
| United Kingdom, Colonies | 3,352 | 1.2 | 15 |
| TOTAL — TOP 15 | 208,961 | 75.6 | — |
| TOTAL — OTHERS | 66,922 | 24.5 | — |
| GRAND TOTAL | 275,883 | 100 | — |
| SOURCE COUNTRY | NUMBER | PERCENTAGE | RANK |
|---|---|---|---|
| China | 95,731 | 31.4 | 1 |
| India | 34,887 | 11.4 | 2 |
| South Korea | 19,123 | 6.3 | 3 |
| France | 16,486 | 5.4 | 4 |
| Saudi Arabia | 13,955 | 4.6 | 5 |
| United States | 12,263 | 4.0 | 6 |
| Brazil | 7,757 | 2.5 | 7 |
| Nigeria | 6,903 | 2.3 | 8 |
| Japan | 6,604 | 2.2 | 9 |
| Mexico | 5,306 | 1.7 | 10 |
| Iran | 5,177 | 1.7 | 11 |
| Vietnam | 4,173 | 1.4 | 12 |
| Pakistan | 4,045 | 1.3 | 13 |
| Taiwan | 3,500 | 1.1 | 14 |
| United Kingdom, Colonies | 3,462 | 1.1 | 15 |
| TOTAL — TOP 15 | 239,372 | 78.6 | — |
| TOTAL — OTHERS | 65,504 | 21.4 | — |
| GRAND TOTAL | 304,876 | 100 | — |
Again, this refers to the total number of students in the country, not the amount of visas issued in any given year. Needless to say, those numbers continue to climb as well. Note: page 48 of the same document gives even higher totals for the same years.
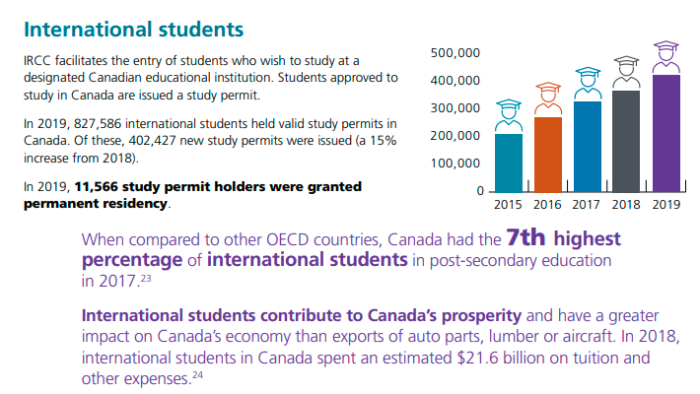
For a reference point, consider page 15 of the 2020 Canada Annual Immigration Report to Parliament. It was reported that:
“In 2019, 827,586 international students held valid study permits in Canada. Of these, 402,427 new study permits were issued (a 15% increase from 2018).”
This means that the number of foreign students has nearly tripled from 2013 to 2019/2020. This is a major source of people entering the country.
Keep in mind, there are many, MANY pathways for international students to stay longer, or transition into permanent residents. The probable reason for not being open about this is to minimize the backlash from the already high immigration rates.
A little self promotion: Borderless Canada is still available online. Learn about what’s been going on in this country. Virtually all major issues can be directly tied to immigration and border security, and it’s not racist or bigoted to discuss these hard truths.
(A.0) https://epe.lac-bac.gc.ca/100/202/301/immigration_statistics-ef/index.html
(A.1) https://epe.lac-bac.gc.ca/100/202/301/immigration_statistics-ef/mp22-1_1966.pdf
Canada Immigration Statistics 1966
(A.2) https://epe.lac-bac.gc.ca/100/202/301/immigration_statistics-ef/mp22-1_1967.pdf
Canada Immigration Statistics 1967
(A.3) https://epe.lac-bac.gc.ca/100/202/301/immigration_statistics-ef/mp22-1_1968.pdf
Canada Immigration Statistics 1968
(A.4) https://epe.lac-bac.gc.ca/100/202/301/immigration_statistics-ef/mp22-1_1969.pdf
Canada Immigration Statistics 1969
(A.5) https://epe.lac-bac.gc.ca/100/202/301/immigration_statistics-ef/mp22-1_1970.pdf
Canada Immigration Statistics 1970
(A.6) https://epe.lac-bac.gc.ca/100/202/301/immigration_statistics-ef/mp22-1_1971.pdf
Canada Immigration Statistics 1971
(A.7) https://epe.lac-bac.gc.ca/100/202/301/immigration_statistics-ef/mp22-1_1972.pdf
Canada Immigration Statistics 1972
(A.8) https://epe.lac-bac.gc.ca/100/202/301/immigration_statistics-ef/mp22-1_1973.pdf
Canada Immigration Statistics 1973
(A.9) https://epe.lac-bac.gc.ca/100/202/301/immigration_statistics-ef/mp22-1_1974.pdf
Canada Immigration Statistics 1974
(A.10) https://epe.lac-bac.gc.ca/100/202/301/immigration_statistics-ef/mp22-1_1975.pdf
Canada Immigration Statistics 1975
(A.11) https://epe.lac-bac.gc.ca/100/202/301/immigration_statistics-ef/mp22-1_1976.pdf
Canada Immigration Statistics 1976
(A.12) https://epe.lac-bac.gc.ca/100/202/301/immigration_statistics-ef/mp22-1_1977.pdf
Canada Immigration Statistics 1977
(A.13) https://epe.lac-bac.gc.ca/100/202/301/immigration_statistics-ef/mp22-1_1978.pdf
Canada Immigration Statistics 1978
(A.14) https://epe.lac-bac.gc.ca/100/202/301/immigration_statistics-ef/mp22-1_1979.pdf
Canada Immigration Statistics 1979
(A.15) https://epe.lac-bac.gc.ca/100/202/301/immigration_statistics-ef/mp22-1_1980.pdf
Canada Immigration Statistics 1980
(A.16) https://epe.lac-bac.gc.ca/100/202/301/immigration_statistics-ef/mp22-1_1981.pdf
Canada Immigration Statistics 1981
(A.17) https://epe.lac-bac.gc.ca/100/202/301/immigration_statistics-ef/mp22-1_1982.pdf
Canada Immigration Statistics 1982
(A.18) https://epe.lac-bac.gc.ca/100/202/301/immigration_statistics-ef/mp22-1_1983.pdf
Canada Immigration Statistics 1983
(A.19) https://epe.lac-bac.gc.ca/100/202/301/immigration_statistics-ef/mp22-1_1984.pdf
Canada Immigration Statistics 1984
(A.20) https://epe.lac-bac.gc.ca/100/202/301/immigration_statistics-ef/mp22-1_1985.pdf
Canada Immigration Statistics 1985
(A.21) https://epe.lac-bac.gc.ca/100/202/301/immigration_statistics-ef/mp22-1_1986.pdf
Canada Immigration Statistics 1986
(A.22) https://epe.lac-bac.gc.ca/100/202/301/immigration_statistics-ef/mp22-1_1987.pdf
Canada Immigration Statistics 1987
(A.23) https://epe.lac-bac.gc.ca/100/202/301/immigration_statistics-ef/mp22-1_1988.pdf
Canada Immigration Statistics 1988
(A.24) https://epe.lac-bac.gc.ca/100/202/301/immigration_statistics-ef/mp22-1_1989.pdf
Canada Immigration Statistics 1989
(A.25) https://epe.lac-bac.gc.ca/100/202/301/immigration_statistics-ef/mp22-1_1990.pdf
Canada Immigration Statistics 1990
(A.26) https://epe.lac-bac.gc.ca/100/202/301/immigration_statistics-ef/mp22-1_1991.pdf
Canada Immigration Statistics 1991
(A.27) https://epe.lac-bac.gc.ca/100/202/301/immigration_statistics-ef/mp22-1_1992.pdf
Canada Immigration Statistics 1992
(A.28) https://epe.lac-bac.gc.ca/100/202/301/immigration_statistics-ef/mp22-1_1993.pdf
Canada Immigration Statistics 1993
(A.29) https://epe.lac-bac.gc.ca/100/202/301/immigration_statistics-ef/mp22-1_1994.pdf
Canada Immigration Statistics 1994
(A.30) https://epe.lac-bac.gc.ca/100/202/301/immigration_statistics-ef/mp22-1_1995.pdf
Canada Immigration Statistics 1995
(A.31) https://epe.lac-bac.gc.ca/100/202/301/immigration_statistics-ef/mp22-1_1996.pdf
Canada Immigration Statistics 1996
(B.0) https://publications.gc.ca/site/eng/9.505817/publication.html
https://www.canada.ca/en/immigration-refugees-citizenship/corporate/reports-statistics/statistics-open-data.html
(B.1) https://publications.gc.ca/collections/collection_2010/cic/MP43-333-1999-eng.pdf
Canada Immigration Facts And Figures 1998
(B.2) https://publications.gc.ca/collections/Collection/MP43-333-2000E.pdf
(B.3) https://publications.gc.ca/collections/collection_2015/cic/Ci1-8-10-2013-eng.pdf
Temporary Migration In Canada 2004-2013
(C.0) Parliament Report Index
http://archive.is/vwM6G
(C.1) 2004 Report to Canadian Parliament
2004.annual.immigration.report.to.parliament
(C.2) 2005 Report to Canadian Parliament
2005.annual.immigration.report.to.parliament
(C.3) 2006 Report to Canadian Parliament
2006.annual.immigration.report.to.parliament
(C.4) 2007 Report to Canadian Parliament
2007.annual.immigration.report.to.parliament
(C.5) 2008 Report to Canadian Parliament
2008.annual.immigration.report.to.parliament
(C.6) 2009 report to Canadian Parliament
2009.annual.immigration.report.to.parliament
(C.7) 2010 Report to Canadian Parliament
2010.annual.immigration.report.to.parliament
(C.8) 2011 Report to Canadian Parliament
2011.annual.immigration.report.to.parliament
(C.9) 2012 Report to Canadian Parliament
2012.annual.immigration.report.to.parliament
(C.10) 2013 Report to Canadian Parliament
2013.annual.immigration.report.to.parliament
(C.11) 2014 Report to Canadian Parliament
2014.annual.immigration.report.to.parliament
(C.12) 2015 Report to Canadian Parliament
2015.annual.immigration.report.to.parliament
(C.13) 2016 Report to Canadian Parliament
2016.annual.immigration.report.to.parliament
(C.14) 2017 Report to Canadian Parliament
2017.annual.immigration.report.to.parliament
(C.15) 2018 Report to CDN Parliament
2018.annual.immigration.report.to.parliament
(C.15.2) 2019-2021 Supplemental Report
http://archive.is/onyev
(C.16) 2019 Report to Canadian Parliament
2019.annual.immigration.report.to.parliament
(C.17) 2020 Report to Canadian Parliament
2020.annual.immigration.report.to.parliament
(C.18) 2021 Report to Canadian Parliament
2021.annual.immigration.report.to.parliament
Discover more from Canuck Law
Subscribe to get the latest posts sent to your email.