
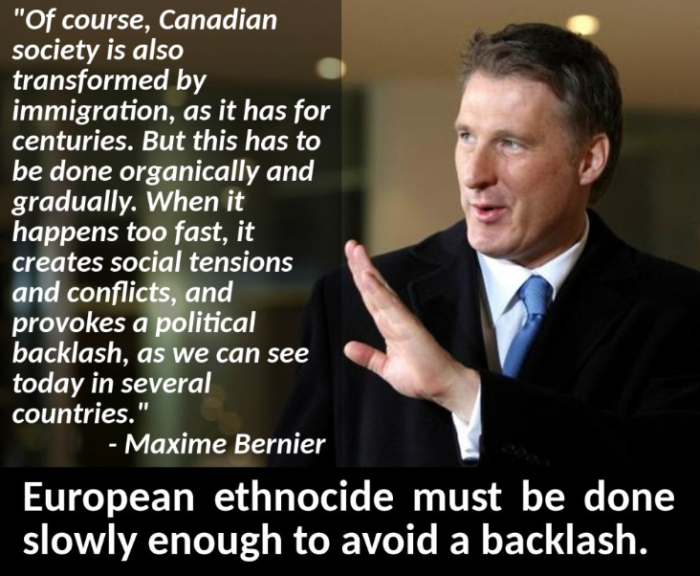
The Kalergi Plan was laid out for Europe a century ago. The goal was to ultimately get rid of all the whites, with a combination of open doors immigration, depressed local birth rates, and miscegenation. That said, the plot is not limited to Europe, but to all white countries.
Forced diversity is code for genocide.
1. Mass LEGAL Immigration In Canada
Despite what many think, LEGAL immigration into Canada is actually a much larger threat than illegal aliens, given the true scale of the replacement that is happening. What was founded as a European (British) colony is becoming unrecognizable due to forced demographic changes. There are also social, economic, environmental and voting changes to consider. See this Canadian series, and the UN programs for more detail. Politicians, the media, and so-called “experts” have no interest in coming clean on this.
CLICK HERE, for UN Genocide Prevention/Punishment Convention.
CLICK HERE, for Barcelona Declaration & Kalergi Plan.
CLICK HERE, for UN Kalergi Plan (population replacement).
CLICK HERE, for UN replacement efforts since 1974.
CLICK HERE, for tracing steps of UN replacement agenda.
Note: If there are errors in calculating the totals, please speak up. Information is of no use to the public if it isn’t accurate.
2. Genocidal Population Replacement Long Time Problem
Let’s have a look at some of those recent years. While 2003 to 2020 has already been covered pretty extensively on this site, the problem extends much further than that.
| SOURCE COUNTRY | NUMBER | PERCENTAGE | RANK |
|---|---|---|---|
| Hong Kong | 19,908 | 10.4 | 1 |
| Poland | 15,985 | 8.3 | 2 |
| Philippines | 11,383 | 5.9 | 3 |
| Vietnam | 9,425 | 4.9 | 4 |
| India | 8,819 | 4.6 | 5 |
| United Kingdom | 8,420 | 4.4 | 6 |
| Portugal | 8,189 | 4.3 | 7 |
| United States | 6,931 | 3.6 | 8 |
| Lebanon | 6,179 | 3.2 | 9 |
| China | 4,430 | 2.3 | 10 |
| TOTAL — TOP 10 | 99,679 | 51.9 | — |
| TOTAL — OTHERS | 92,322 | 48.1 | — |
| GRAND TOTAL | 193,001 | 100 | — |
| REGION | NUMBER | PERCENTAGE |
|---|---|---|
| Africa and the Middle East | 12,199 | 6.3 |
| Asia and Pacific | 93,261 | 48.6 |
| South America | 8,685 | 4.5 |
| United States | 6,931 | 3.6 |
| Europe and the United Kingdom | 52,107 | 27.1 |
| North/Central America | 5,870 | 3.1 |
| Caribbean/Antilles | 10,909 | 5.7 |
| Others | 2,041 | 1.1 |
| Total | 193,001 | 100 |
| SOURCE COUNTRY | NUMBER | PERCENTAGE | RANK |
|---|---|---|---|
| Hong Kong | 29,261 | 13.7 | 1 |
| Poland | 16,579 | 7.7 | 2 |
| Lebanon | 12,462 | 5.8 | 3 |
| Philippines | 12,042 | 5.6 | 4 |
| India | 10,624 | 5.1 | 5 |
| Vietnam | 9,081 | 4.2 | 6 |
| United Kingdom | 8,217 | 3.8 | 7 |
| China | 7,987 | 3.7 | 8 |
| Portugal | 7,917 | 3.7 | 9 |
| United | 6,084 | 2.8 | 10 |
| TOTAL — TOP 10 | 120,256 | 56.1 | — |
| TOTAL — OTHERS | 93,974 | 43.9 | — |
| GRAND TOTAL | 214,230 | 100 | — |
| REGION | NUMBER | PERCENTAGE |
|---|---|---|
| Africa and the Middle East | 13,440 | 6.3 |
| Asia and Pacific | 111,739 | 52.2 |
| South America | 8,898 | 4.2 |
| United States | 6,084 | 2.8 |
| Europe and the United Kingdom | 51,945 | 24.3 |
| North/Central America | 7,781 | 3.6 |
| Caribbean/Antilles | 11,689 | 5.5 |
| Others | 2,654 | 1.2 |
| Total | 214,230 | 100 |
| SOURCE COUNTRY | NUMBER | PERCENTAGE | RANK |
|---|---|---|---|
| Hong Kong | 22,340 | 9.7 | 1 |
| Poland | 15,731 | 6.8 | 2 |
| China | 13,915 | 6.0 | 3 |
| India | 12,848 | 5.6 | 4 |
| Philippines | 12,335 | 5.3 | 5 |
| Lebanon | 11,987 | 5.2 | 6 |
| Vietnam | 8,963 | 3.9 | 7 |
| United Kingdom | 7,543 | 3.3 | 8 |
| El Salvador | 6,977 | 3.0 | 9 |
| Sri Lanka | 6,826 | 3.0 | 10 |
| TOTAL — TOP 10 | 119,465 | 51.8 | — |
| TOTAL — OTHERS | 111,316 | 48.2 | — |
| GRAND TOTAL | 230,781 | 100 | — |
| REGION | NUMBER | PERCENTAGE |
|---|---|---|
| Africa and the Middle East | 16,087 | 7.0 |
| Asia and Pacific | 119,955 | 52.0 |
| South America | 10,582 | 4.6 |
| United States | 6,597 | 2.9 |
| Europe and the United Kingdom | 48,055 | 20.8 |
| North/Central America | 13,404 | 5.8 |
| Caribbean/Antilles | 12,922 | 5.6 |
| Others | 3,179 | 1.4 |
| Total | 230,781 | 100 |
| SOURCE COUNTRY | NUMBER | PERCENTAGE | RANK |
|---|---|---|---|
| Hong Kong | 38,910 | 15.4 | 1 |
| Philippines | 13,273 | 5.2 | 2 |
| India | 12,675 | 5.0 | 3 |
| Sri Lanka | 12,635 | 5.0 | 4 |
| Poland | 11,878 | 4.7 | 5 |
| China | 10,429 | 4.1 | 6 |
| Vietnam | 7,681 | 3.2 | 7 |
| United States | 7,537 | 3.0 | 8 |
| Taiwan | 7,456 | 2.9 | 9 |
| United Kingdom | 7,138 | 2.8 | 10 |
| TOTAL — TOP 10 | 129,612 | 51.3 | — |
| TOTAL — OTHERS | 123,230 | 48.7 | — |
| GRAND TOTAL | 252,842 | 100 | — |
| REGION | NUMBER | PERCENTAGE |
|---|---|---|
| Africa and the Middle East | 19,633 | 7.7 |
| Asia and Pacific | 139,216 | 54.4 |
| South America | 10,389 | 4.1 |
| United States | 7,537 | 2.9 |
| Europe and the United Kingdom | 44,871 | 17.5 |
| North/Central America | 12,526 | 4.9 |
| Caribbean/Antilles | 14,952 | 5.8 |
| Others | 3,718 | 1.5 |
| Total | 252,842 | 100 |
| SOURCE COUNTRY | NUMBER | PERCENTAGE | RANK |
|---|---|---|---|
| Hong Kong | 36,574 | 14.3 | 1 |
| India | 20,472 | 8.0 | 2 |
| Philippines | 19,772 | 7.7 | 3 |
| Taiwan | 9,867 | 3.9 | 4 |
| China | 9,466 | 3.7 | 5 |
| Sri Lanka | 9,103 | 3.6 | 6 |
| Vietnam | 8,301 | 3.2 | 7 |
| United States | 8,014 | 3.1 | 8 |
| United Kingdom | 7,159 | 2.8 | 9 |
| Poland | 6,877 | 2.7 | 10 |
| TOTAL — TOP 10 | 135,605 | 53.0 | — |
| TOTAL — OTHERS | 120,214 | 47.0 | — |
| GRAND TOTAL | 255,819 | 100 | — |
| REGION | NUMBER | PERCENTAGE |
|---|---|---|
| Africa and the Middle East | 16,918 | 6.6 |
| Asia and Pacific | 147,323 | 57.6 |
| South America | 9,580 | 3.7 |
| United States | 8,014 | 3.1 |
| Europe and the United Kingdom | 46,602 | 18.2 |
| North/Central America | 7,737 | 3.0 |
| Caribbean/Antilles | 16,563 | 6.5 |
| Others | 3,082 | 1.2 |
| Total | 255,819 | 100 |
| SOURCE COUNTRY | NUMBER | PERCENTAGE | RANK |
|---|---|---|---|
| Hong Kong | 44,169 | 19.7 | 1 |
| Philippines | 19,097 | 8.5 | 2 |
| India | 17,225 | 7.7 | 3 |
| China | 12,486 | 5.6 | 4 |
| Taiwan | 7,411 | 3.3 | 5 |
| Sri Lanka | 6,671 | 3.0 | 6 |
| United States | 6,234 | 2.8 | 7 |
| Vietnam | 6,230 | 2.8 | 8 |
| United Kingdom | 5,971 | 2.8 | 9 |
| Bosnia-Hercegovina | 4,905 | 2.2 | 10 |
| TOTAL — TOP 10 | 130,399 | 58.2 | — |
| TOTAL — OTHERS | 93,476 | 41.8 | — |
| GRAND TOTAL | 223,875 | 100 | — |
| REGION | NUMBER | PERCENTAGE |
|---|---|---|
| Africa and the Middle East | 13,706 | 6.1 |
| Asia and Pacific | 141,587 | 63.2 |
| South America | 7,919 | 3.5 |
| United States | 6,234 | 2.8 |
| Europe and the United Kingdom | 38,641 | 17.3 |
| North/Central America | 3,503 | 1.6 |
| Caribbean/Antilles | 9,980 | 4.5 |
| Others | 2,215 | 1.0 |
| Total | 223,875 | 100 |
| SOURCE COUNTRY | NUMBER | PERCENTAGE | RANK |
|---|---|---|---|
| Hong Kong | 31,746 | 14.9 | 1 |
| India | 16,215 | 7.6 | 2 |
| Philippines | 15,149 | 7.1 | 3 |
| China | 13,291 | 6.3 | 4 |
| Sri Lanka | 8,926 | 4.2 | 5 |
| Taiwan | 7,691 | 3.6 | 6 |
| Bosnia-Hercegovina | 6,270 | 3.0 | 7 |
| United Kingdom | 6,161 | 2.9 | 8 |
| United States | 5,185 | 2.4 | 9 |
| Pakistan | 3,996 | 1.9 | 10 |
| TOTAL — TOP 10 | 114,630 | 53.9 | — |
| TOTAL — OTHERS | 97,874 | 46.1 | — |
| GRAND TOTAL | 212,504 | 100 | — |
| REGION | NUMBER | PERCENTAGE |
|---|---|---|
| Africa and the Middle East | 14,631 | 6.9 |
| Asia and Pacific | 129,106 | 60.8 |
| South America | 7,538 | 3.5 |
| United States | 5,185 | 2.4 |
| Europe and the United Kingdom | 41,266 | 19.4 |
| North/Central America | 2,842 | 1.3 |
| Caribbean/Antilles | 10,056 | 4.5 |
| Others | 1,880 | 0.8 |
| Total | 212,504 | 100 |
| SOURCE COUNTRY | NUMBER | PERCENTAGE | RANK |
|---|---|---|---|
| Hong Kong | 29,966 | 13.3 | 1 |
| India | 21,276 | 9.4 | 2 |
| China | 17,516 | 7.8 | 3 |
| Taiwan | 13,207 | 5.8 | 4 |
| Philippines | 13,132 | 5.8 | 5 |
| Pakistan | 7,753 | 3.4 | 6 |
| Sri Lanka | 6,151 | 2.7 | 7 |
| United States | 5,837 | 2.6 | 8 |
| Iran | 5,828 | 2.6 | 9 |
| United Kingdom | 5,585 | 2.5 | 10 |
| TOTAL — TOP 10 | 126,251 | 55.9 | — |
| TOTAL — OTHERS | 99,522 | 44.1 | — |
| GRAND TOTAL | 225,773 | 100 | — |
| REGION | NUMBER | PERCENTAGE |
|---|---|---|
| Africa and the Middle East | 36,503 | 16.15 |
| Asia and Pacific | 124,771 | 55.20 |
| South and Central America | 18,878 | 8.35 |
| United States | 5,869 | 2.60 |
| Europe and the United Kingdom | 40,009 | 17.70 |
| Not Stated | 20 | 0.01 |
| Total | 225,773 | 100 |
| SOURCE COUNTRY | NUMBER | PERCENTAGE | RANK |
|---|---|---|---|
| Hong Kong | 22,242 | 10.30 | 1 |
| India | 19,614 | 9.08 | 2 |
| China | 18,530 | 8.58 | 3 |
| Taiwan | 13,321 | 6.17 | 4 |
| Pakistan | 11,233 | 5.20 | 5 |
| Philippines | 10,873 | 5.03 | 6 |
| Iran | 7,477 | 3.46 | 7 |
| Sri Lanka | 5,069 | 2.35 | 8 |
| United States | 5,043 | 2.33 | 9 |
| United Kingdom | 4,659 | 2.16 | 10 |
| TOTAL — TOP 10 | 118,061 | 54.65 | — |
| TOTAL — OTHERS | 97,983 | 45.35 | — |
| GRAND TOTAL | 216,044 | 100 | — |
| REGION | NUMBER | PERCENTAGE |
|---|---|---|
| Africa and the Middle East | 37,794 | 17.49 |
| Asia and Pacific | 117,076 | 54.19 |
| South and Central America | 17,425 | 8.07 |
| United States | 5,043 | 2.33 |
| Europe and the United Kingdom | 38,673 | 17.90 |
| Not Stated | 33 | 0.02 |
| Total | 216,044 | 100 |
| SOURCE COUNTRY | NUMBER | PERCENTAGE | RANK |
|---|---|---|---|
| China | 19,749 | 11.34 | 1 |
| India | 11.34 | 8.80 | 2 |
| Philippines | 8,172 | 4.69 | 3 |
| Hong Kong | 8,083 | 4.64 | 4 |
| Pakistan | 8,081 | 4.64 | 5 |
| Taiwan | 7,164 | 4.11 | 6 |
| Iran | 6,772 | 3.89 | 7 |
| South Korea | 4,910 | 2.82 | 8 |
| United States | 4,764 | 2.74 | 9 |
| Russia | 4,299 | 2.47 | 10 |
| TOTAL — TOP 10 | 87,321 | 50.16 | — |
| TOTAL — OTHERS | 86,779 | 49.84 | — |
| GRAND TOTAL | 174,100 | 100 | — |
| REGION | NUMBER | PERCENTAGE |
|---|---|---|
| Africa and the Middle East | 32,534 | 18.69 |
| Asia and Pacific | 84,036 | 48.27 |
| South and Central America | 14,003 | 8.04 |
| United States | 4,764 | 2.74 |
| Europe and the United Kingdom | 38,477 | 22.10 |
| Not Stated | 286 | 0.16 |
| Total | 174,100 | 100 |
Source for 1995/1996:
Source for 1996-1998
Are things starting to make sense? Immigration policies for the last 50+ years have focused on Asians and Africans, replacing (to a large degree) the overwhelmingly European makeup that was Canada for many years.
Of course, speaking up about what’s apparent will lead to cries of racism.

One thing people really need to get clear: so-called “conservatives” have no interest whatsoever in preserving demographics or the makeup of a country. They fully support the genocide agenda, but try to pitch it from a more economic perspective.
White replacement is a very real thing. Only the most obtuse or unobservant cannot see what’s going on, especially given how blatant it is..
While Liberals are generally quite open for their disdain of Europeans, “Conservatives” behave in a stealthier and more subversive manner. They camouflage their true intentions, making them more dangerous.
A little self promotion: Borderless Canada is still available online. Learn about what’s been going on in this country. Virtually all major issues can be directly tied to immigration and border security, and it’s not racist or bigoted to discuss these hard truths.
3. Documents Provided By Canadian Government
(A.0) https://epe.lac-bac.gc.ca/100/202/301/immigration_statistics-ef/index.html
(A.1) https://epe.lac-bac.gc.ca/100/202/301/immigration_statistics-ef/mp22-1_1966.pdf
Canada Immigration Statistics 1966
(A.2) https://epe.lac-bac.gc.ca/100/202/301/immigration_statistics-ef/mp22-1_1967.pdf
Canada Immigration Statistics 1967
(A.3) https://epe.lac-bac.gc.ca/100/202/301/immigration_statistics-ef/mp22-1_1968.pdf
Canada Immigration Statistics 1968
(A.4) https://epe.lac-bac.gc.ca/100/202/301/immigration_statistics-ef/mp22-1_1969.pdf
Canada Immigration Statistics 1969
(A.5) https://epe.lac-bac.gc.ca/100/202/301/immigration_statistics-ef/mp22-1_1970.pdf
Canada Immigration Statistics 1970
(A.6) https://epe.lac-bac.gc.ca/100/202/301/immigration_statistics-ef/mp22-1_1971.pdf
Canada Immigration Statistics 1971
(A.7) https://epe.lac-bac.gc.ca/100/202/301/immigration_statistics-ef/mp22-1_1972.pdf
Canada Immigration Statistics 1972
(A.8) https://epe.lac-bac.gc.ca/100/202/301/immigration_statistics-ef/mp22-1_1973.pdf
Canada Immigration Statistics 1973
(A.9) https://epe.lac-bac.gc.ca/100/202/301/immigration_statistics-ef/mp22-1_1974.pdf
Canada Immigration Statistics 1974
(A.10) https://epe.lac-bac.gc.ca/100/202/301/immigration_statistics-ef/mp22-1_1975.pdf
Canada Immigration Statistics 1975
(A.11) https://epe.lac-bac.gc.ca/100/202/301/immigration_statistics-ef/mp22-1_1976.pdf
Canada Immigration Statistics 1976
(A.12) https://epe.lac-bac.gc.ca/100/202/301/immigration_statistics-ef/mp22-1_1977.pdf
Canada Immigration Statistics 1977
(A.13) https://epe.lac-bac.gc.ca/100/202/301/immigration_statistics-ef/mp22-1_1978.pdf
Canada Immigration Statistics 1978
(A.14) https://epe.lac-bac.gc.ca/100/202/301/immigration_statistics-ef/mp22-1_1979.pdf
Canada Immigration Statistics 1979
(A.15) https://epe.lac-bac.gc.ca/100/202/301/immigration_statistics-ef/mp22-1_1980.pdf
Canada Immigration Statistics 1980
(A.16) https://epe.lac-bac.gc.ca/100/202/301/immigration_statistics-ef/mp22-1_1981.pdf
Canada Immigration Statistics 1981
(A.17) https://epe.lac-bac.gc.ca/100/202/301/immigration_statistics-ef/mp22-1_1982.pdf
Canada Immigration Statistics 1982
(A.18) https://epe.lac-bac.gc.ca/100/202/301/immigration_statistics-ef/mp22-1_1983.pdf
Canada Immigration Statistics 1983
(A.19) https://epe.lac-bac.gc.ca/100/202/301/immigration_statistics-ef/mp22-1_1984.pdf
Canada Immigration Statistics 1984
(A.20) https://epe.lac-bac.gc.ca/100/202/301/immigration_statistics-ef/mp22-1_1985.pdf
Canada Immigration Statistics 1985
(A.21) https://epe.lac-bac.gc.ca/100/202/301/immigration_statistics-ef/mp22-1_1986.pdf
Canada Immigration Statistics 1986
(A.22) https://epe.lac-bac.gc.ca/100/202/301/immigration_statistics-ef/mp22-1_1987.pdf
Canada Immigration Statistics 1987
(A.23) https://epe.lac-bac.gc.ca/100/202/301/immigration_statistics-ef/mp22-1_1988.pdf
Canada Immigration Statistics 1988
(A.24) https://epe.lac-bac.gc.ca/100/202/301/immigration_statistics-ef/mp22-1_1989.pdf
Canada Immigration Statistics 1989
(A.25) https://epe.lac-bac.gc.ca/100/202/301/immigration_statistics-ef/mp22-1_1990.pdf
Canada Immigration Statistics 1990
(A.26) https://epe.lac-bac.gc.ca/100/202/301/immigration_statistics-ef/mp22-1_1991.pdf
Canada Immigration Statistics 1991
(A.27) https://epe.lac-bac.gc.ca/100/202/301/immigration_statistics-ef/mp22-1_1992.pdf
Canada Immigration Statistics 1992
(A.28) https://epe.lac-bac.gc.ca/100/202/301/immigration_statistics-ef/mp22-1_1993.pdf
Canada Immigration Statistics 1993
(A.29) https://epe.lac-bac.gc.ca/100/202/301/immigration_statistics-ef/mp22-1_1994.pdf
Canada Immigration Statistics 1994
(A.30) https://epe.lac-bac.gc.ca/100/202/301/immigration_statistics-ef/mp22-1_1995.pdf
Canada Immigration Statistics 1995
(A.31) https://epe.lac-bac.gc.ca/100/202/301/immigration_statistics-ef/mp22-1_1996.pdf
Canada Immigration Statistics 1996
(B.0) https://publications.gc.ca/site/eng/9.505817/publication.html
https://www.canada.ca/en/immigration-refugees-citizenship/corporate/reports-statistics/statistics-open-data.html
(B.1) https://publications.gc.ca/collections/collection_2010/cic/MP43-333-1999-eng.pdf
Canada Immigration Facts And Figures 1998
(B.2) https://publications.gc.ca/collections/Collection/MP43-333-2000E.pdf
(C.0) Parliament Report Index
http://archive.is/vwM6G
(C.1) 2004 Report to Canadian Parliament
2004.annual.immigration.report.to.parliament
(C.2) 2005 Report to Canadian Parliament
2005.annual.immigration.report.to.parliament
(C.3) 2006 Report to Canadian Parliament
2006.annual.immigration.report.to.parliament
(C.4) 2007 Report to Canadian Parliament
2007.annual.immigration.report.to.parliament
(C.5) 2008 Report to Canadian Parliament
2008.annual.immigration.report.to.parliament
(C.6) 2009 report to Canadian Parliament
2009.annual.immigration.report.to.parliament
(C.7) 2010 Report to Canadian Parliament
2010.annual.immigration.report.to.parliament
(C.8) 2011 Report to Canadian Parliament
2011.annual.immigration.report.to.parliament
(C.9) 2012 Report to Canadian Parliament
2012.annual.immigration.report.to.parliament
(C.10) 2013 Report to Canadian Parliament
2013.annual.immigration.report.to.parliament
(C.11) 2014 Report to Canadian Parliament
2014.annual.immigration.report.to.parliament
(C.12) 2015 Report to Canadian Parliament
2015.annual.immigration.report.to.parliament
(C.13) 2016 Report to Canadian Parliament
2016.annual.immigration.report.to.parliament
(C.14) 2017 Report to Canadian Parliament
2017.annual.immigration.report.to.parliament
(C.15) 2018 Report to CDN Parliament
2018.annual.immigration.report.to.parliament
(C.15.2) 2019-2021 Supplemental Report
http://archive.is/onyev
(C.16) 2019 Report to Canadian Parliament
2019.annual.immigration.report.to.parliament
(C.17) 2020 Report to Canadian Parliament
2020.annual.immigration.report.to.parliament
(C.18) 2021 Report to Canadian Parliament
2021.annual.immigration.report.to.parliament
Discover more from Canuck Law
Subscribe to get the latest posts sent to your email.
If people continue to vote in these manufactured consent events (elections) and if they keep believing professional World Government politicians, such as Poilievre, they deserve what they get. Plain and simple. The evidence is all out there, and now there is no excuse for wilful blindness and stupidity.
Thanks for doing this hard work Ronnie…too bad more Canadians were not like you.