
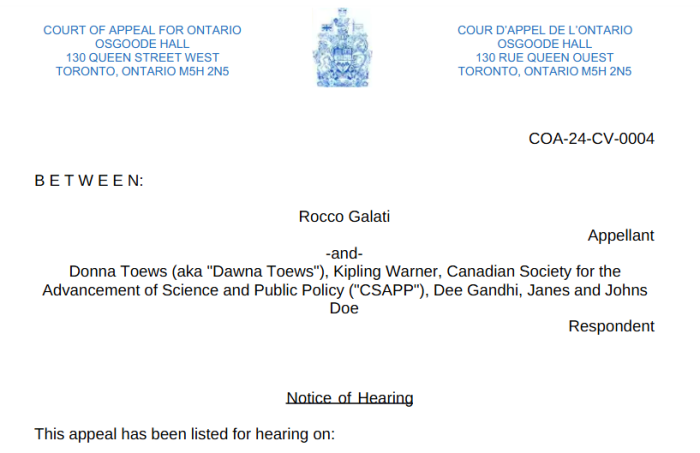
A high profile defamation Appeal is now scheduled to be heard in the new year. The Court of Appeal for Ontario will hear arguments on January 13th, 2025, to determine whether or not Justice Chalmers should have thrown out a lawsuit in late 2023 under anti-SLAPP laws. There’s also a challenge to the $132,000 cost award that was handed down.
This is the $1.1 million “intimidation lawsuit” brought against CSASPP, the Canadian Society for the Advancement of Science in Public Policy, and one of their donors. For more background, see the decision and the cost award. They provide the necessary information to understanding how events played out.
Supposedly, it was over a “defamatory” email to Dan Dicks of Press for Truth, and a posting on CSASPP’s FAQ page. In reality, the suit was filed to derail the Law Society of Ontario (LSO) complaint filed by Donna Toews.
[89] With respect to the claim against Ms. Toews, I am of the view that “what is really going on” is an attempt to intimidate members of the public who may be considering making a complaint about the Plaintiff to the LSO. The effect of the action against Ms. Toews would be to obstruct the regulatory process. The harm this would cause in the LSO’s ability to receive and process complaints about lawyers is, in my view significant.
[98] For the reasons set out above, I find that the Plaintiff brought this action for the improper purpose of stifling debate with respect to his handling of a proposed class action that is being funded by public donations. I also note that the Claim was brought one day before the Plaintiff submitted a response to the LSO with respect to Ms. Toews complaint. I find that the Claim was brought for the improper purpose of limiting the LSO investigation, and to intimidate others from making any LSO complaints about him.
Justice Chalmers made it clear in paragraphs 89 and 98 of his decision that this was an intimidation lawsuit, designed at least in part to stop others from filing complaints with the LSO.
And it didn’t stop there. The LSO itself was sued in 2022, and again, in 2023, to further bury the Toews complaint. The earlier one was struck for failing to state a Cause of Action (ask for something the Court can actually provide). No amended Statement of Claim has been filed, and the other case appears inactive.
Included are the Factums of both sides, which are the arguments submitted. For reference, the Appellant(s) are the ones who commence the proceedings, while the Respondents are the ones who have to answer. There is an Appeal Record of several thousand pages, but it’s primarily a compilation of documents previously submitted.
Anyhow, here are some points to note.
Appeal Attempts To Reargue Entire Motion
The Appellant’s Factum attempts to reargue the Motion which led to Justice Chalmers throwing the case out. Instead, he should have been outlining the errors the Judge (allegedly) made.
When asking to have a Decision reviewed, there are only a few options.
| TYPE OF ERROR | STANDARD FOR REVIEW |
|---|---|
| Error of Fact | Overriding, Palpable Error |
| Error of Pure Law | Correctness |
| Mixed Fact & Law | Spectrum, Leaning To Overriding, Palpable Error |
| Discretionary Orders | Overriding, Palpable Error |
The correctness standard in law is meant to ensure that litigants are treated fairly, and held to the same standards. If a Lower Court hasn’t done this, then the Higher Court is able to step in.
The overriding, palpable error standard reflects that Judges are often in the best position to oversee the case, and that their decision making ability is owed a deal of deference. This applies to factual findings, and discretionary orders, such as costs and damages. Nonetheless, clear errors can still be fixed.
This is what should have been done: spell out the errors (if any) made by Justice Chalmers. The standard is Housen v. Nikolaisen, set over 20 years ago. Instead, it comes across as a demand to have the original matter reheard. This isn’t the role of the Appellate Courts, and he should know better.
The Respondents’ Factum addresses this quite well.
Appellant’s Ridiculous Demands Regarding Costs
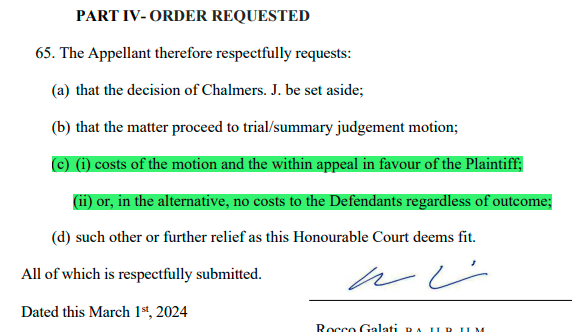
One amusing thing of note is the Relief sought. In fairness, litigants are free to ask for whatever they want, but this is comical. The Appellant asks for costs both for this Appeal, and for the original Motion that he lost. In the alternative, he wants costs waived altogether. Doesn’t work like that.
Repeatedly Implying Justice Chalmers Rigged Decision
31. The Appellant states that not only did Justice Chalmers not apply this binding case from the Ontario Court of Appeal to the facts and evidence before him, Justice Chalmers completely ignored it, and thus erred in law.
41. …. The Plaintiff states that is clearly present in the within action. Justice Chalmers ignored the Supreme Court of Canada jurisprudence in applying the test.
42. …. In the within case there is “grounds to believe”, and “reasonably capable of belief”, that the Plaintiff can succeed on at least one of the “stings”, which he clearly can based on the statements, and law. Again, Justice Chalmers ignored the binding Supreme Court of Canada jurisprudence. Justice Chalmers finding that the assertions were backed up by hyperlinks, makes a final determination that they are “true”. They are not. They are not even “partial truths” and Justice Chalmers does not deal with the Plaintiffs evidence in this respect.
43. …. Again, which is applicable to the within action, more than a single basis exists. Justice
Chalmers ignored this evidence and jurisprudence
44. …. The Plaintiff states that not only did the Society’s website “FAQ” exceed this privilege but coupled with the email to Mr. Dicks, the Defendants went out their way to depict the Plaintiff as incompetent, unprofessional, and dishonest and a fraud. The Defendants’ assertion that they were responding to queries as to the connection between them as the Plaintiff rings false. They could have simply stated that there was no connection between them and the Plaintiff and left it there. Furthermore, their assertions of being flooded with queries and complaints about the Plaintiff also rings false as they could only produce one (1) such query/complaint on cross-examination. Justice Chalmers ignored this binding jurisprudence.
45. …. The Plaintiff states that this also applies to the within action, and that Justice Chalmers ignored this jurisprudence and did NOT deal with an[y] of the above, which was before him and argued by the Plaintiff.
46. …. It is worth noting that, in the within action, all the facts on the findings by the Supreme Court of Canada Bent v. Platnick are more than present here in the within action. The Defendants, engaged in reckless statements and innuendo, without sober investigation, in a singularly distorted and targeted exercise of painting the Plaintiff as generally incompetent, unprofessional, dishonest, and a “fraud”. Any defence of qualified privilege, on fair comment, or responsible publication is therefore defeated. Justice Chalmers does not deal with this argument nor the evidence to support it.
50. …. The Appellant states that the evidence is that, as a result of the defamatory publications the Plaintiff was subject to hostile and viscous reaction from the public at large, including threats to bodily harm, as well as an obliteration of donations to the Constitutional Rights Centre (CRC) as set out in the affidavit evidence. This evidence was not only ignored by Justice Chalmers, but stated not to exist, which is a palatable and blatant error
55. Justice Chalmers further ignores and does not address the Plaintiff’s submissions, and evidence supporting those submissions, on the conspiracy tort pleaded.
56. Justice Chalmers further ignores and does not address the Plaintiff’s submissions and evidence supporting those submissions, contained in paragraphs 59 to 73 of the Plaintiffs factum before the Court.
These quotes are from the Appellant’s Factum. He repeatedly claims that Justice Chalmers “ignored” the information that was put in front of him. One can interpret this as an allegation that the Motion was rigged. Elsewhere in the Factum, it’s implied that he was grossly incompetent.
This really isn’t a good look, if one wants the Ontario Court of Appeal to take this case seriously.
Although not part of the Appeal, the Court probably won’t be amused by this either. At a virtual press conference back on March 27, 2023, he claimed that Judges “are pretending they weren’t pointed to the jurisprudence”. In other words, it’s an accusation that the judicial system is corrupt. Should lawyers be saying such things?
Repeatedly Citing (Largely Irrelevant) Case: Bent V. Platnick
The 2020 Supreme Court of Canada case, Bent v. Platnick, was repeatedly quoted in the original Motion, and again in the Appeal. It was another defamation case, but the allegations made there were far worse than anything CSASPP had published. The levels are so different that it’s actually quite unhelpful.
Appeal Nearly Dismissed For Unnecessary Delay
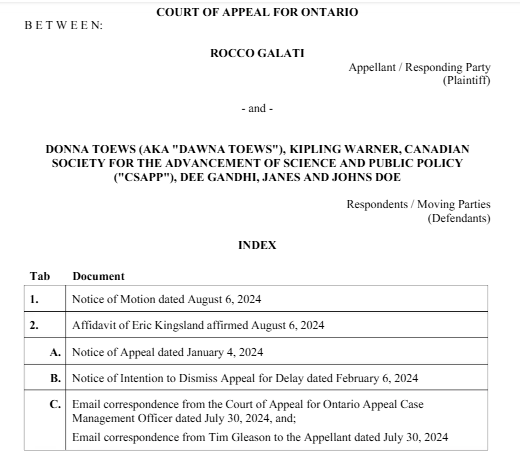
Once an Appellant files all of their major “books”, there’s a final document called the Certificate of Perfection that needs to be included. Aside from the extra fee, it tells the Court that everything has been done, and that a hearing date should be set.
Apparently, it wasn’t done here properly. It was only after a Motion to Dismiss had been brought, that it was filed. Now, it could be sloppiness, but CSASPP believes it to be intentional delay.
Champerty And Maintenance: VCC Donors Paying For Appeal?
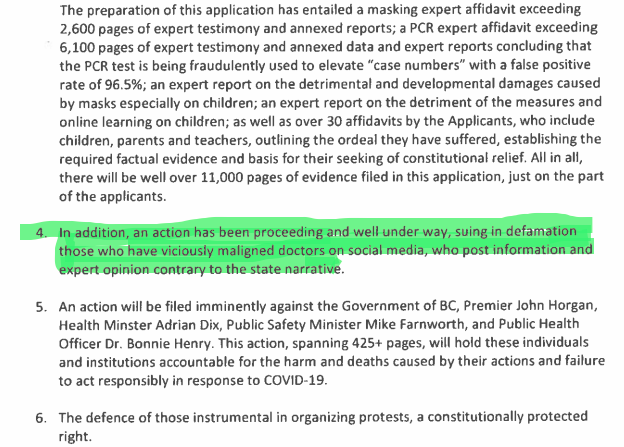
Both Ted Kuntz and Tanya Gaw submitted Affidavits in support of the original claim.
On Exhibit #C, page 21 of Kuntz’s Affidavit, there are remarks indicating that Vaccine Choice Canada had used donor money to finance defamation actions on behalf of doctors on social media. Presumably, this refers to Kulvinder Gill and Ashvinder Lamba.
Now the obvious question: are donors paying for this as well?
Overall, the Appeal comes across as a delay tactic. This is partly to avoid paying the $132,000 in costs that are owed, and partly to avoid the consequences of commencing a lawsuit to sabotage the Toews LSO complaint. But in the end, this Appeal will be dismissed as well.
Ontario’s anti-SLAPP laws (Section 137.1 of the Courts of Justice Act) have “full indemnity” as a default position for costs. This means that if a Defendant is successful in getting such a lawsuit tossed, they are presumptively entitled to 100% of their costs back. This makes defamation suits very risky to pursue.
Of course, a competent lawyer should know that.
CSASPP/RG DOCUMENTS (June 2022)
(1) CSASPP RG Statement Of Claim
(2) CSASPP RG Moving Party Motion Record Volume 1
(3) CSASPP RG Moving Party Motion Record Volume 2
(4) CSASPP RG Moving Party Motion Record Volume 3
(5) CSASPP RG Responding Motion Record Volume 1
(6) CSASPP RG Responding Motion Record Volume 2
(7) CSASPP RG Responding Motion Record Volume 3
(8) CSASPP RG Moving Party Supplemental Motion Record
(9) CSASPP RG Moving Party Record Motion To Strike
(10) CSASPP RG Plaintiffs Responding Record Motion To Strike
(11) CSASPP RG Transcript Brief
(12) CSASPP RG Moving Party Factum (Arguments)
(13) CSASPP RG Responding Plaintiff Factum
(14) CSASPP RG Moving Parties Reply Factum
(15) CSASPP RG Reasons For Judgement
(16) CanLII Posting Of Decision
CSASPP/RG APPEAL DOCUMENTS (2024)
(1) CSASPP Defamation Appellant Factum
(2) CSASPP Defamation Respondent Factum
(3) https://www.covidconstitutionalchallengebc.ca/status-updates
(4) https://www.scribd.com/document/768627727/2024-09-12-Notice-of-Merit-Hearing-13-January-2025
(5) https://www.scribd.com/document/758138683/2024-08-06-Defendant-Respondents-Motion-Record-to-Dismiss-for-Delay
1ST LAW SOCIETY OF ONTARIO CLAIM (July 2022)
(1) Law Society Of Ontario Statement Of Claim
(2) Law Society Of Ontario Intent To Defend
(3) Law Society Of Ontario Amended Statement Of Claim
(4) Law Society Of Ontario Requisition For Amended Claim
(5) Law Society Of Ontario Motion Record, To Strike
(6) Law Society Of Ontario Moving Party Factum To Strike
(7) Law Society Of Ontario Plaintiff Responding Factum
2ND LAW SOCIETY OF ONTARIO CLAIM (July 2023)
(1) Law Society Of Ontario Second Statement Of Claim