Replacement Migration In Canada: The Years 1989 To 1998

The Kalergi Plan was laid out for Europe a century ago. The goal was to ultimately get rid of all the whites, with a combination of open doors immigration, depressed local birth rates, and miscegenation. That said, the plot is not limited to Europe, but to all white countries.

Forced diversity is code for genocide.

1. Mass LEGAL Immigration In Canada

Despite what many think, LEGAL immigration into Canada is actually a much larger threat than illegal aliens, given the true scale of the replacement that is happening. What was founded as a European (British) colony is becoming unrecognizable due to forced demographic changes. There are also social, economic, environmental and voting changes to consider. See this Canadian series, and the UN programs for more detail. Politicians, the media, and so-called “experts” have no interest in coming clean on this.

CLICK HERE, for UN Genocide Prevention/Punishment Convention.
CLICK HERE, for Barcelona Declaration & Kalergi Plan.
CLICK HERE, for UN Kalergi Plan (population replacement).
CLICK HERE, for UN replacement efforts since 1974.
CLICK HERE, for tracing steps of UN replacement agenda.

Note: If there are errors in calculating the totals, please speak up. Information is of no use to the public if it isn’t accurate.

2. Genocidal Population Replacement Long Time Problem

Let’s have a look at some of those recent years. While 2003 to 2020 has already been covered pretty extensively on this site, the problem extends much further than that.

PERMANENT RESIDENTS IN YEAR 1989
SOURCE COUNTRY NUMBER PERCENTAGE RANK
Hong Kong 19,908 10.4 1
Poland 15,985 8.3 2
Philippines 11,383 5.9 3
Vietnam 9,425 4.9 4
India 8,819 4.6 5
United Kingdom 8,420 4.4 6
Portugal 8,189 4.3 7
United States 6,931 3.6 8
Lebanon 6,179 3.2 9
China 4,430 2.3 10
TOTAL — TOP 10 99,679 51.9
TOTAL — OTHERS 92,322 48.1
GRAND TOTAL 193,001 100
PERMANENT RESIDENTS ADMITTED BY REGION IN 1989
REGION NUMBER PERCENTAGE
Africa and the Middle East 12,199 6.3
Asia and Pacific 93,261 48.6
South America 8,685 4.5
United States 6,931 3.6
Europe and the United Kingdom 52,107 27.1
North/Central America 5,870 3.1
Caribbean/Antilles 10,909 5.7
Others 2,041 1.1
Total 193,001 100
PERMANENT RESIDENTS IN YEAR 1990
SOURCE COUNTRY NUMBER PERCENTAGE RANK
Hong Kong 29,261 13.7 1
Poland 16,579 7.7 2
Lebanon 12,462 5.8 3
Philippines 12,042 5.6 4
India 10,624 5.1 5
Vietnam 9,081 4.2 6
United Kingdom 8,217 3.8 7
China 7,987 3.7 8
Portugal 7,917 3.7 9
United 6,084 2.8 10
TOTAL — TOP 10 120,256 56.1
TOTAL — OTHERS 93,974 43.9
GRAND TOTAL 214,230 100
PERMANENT RESIDENTS ADMITTED BY REGION IN 1990
REGION NUMBER PERCENTAGE
Africa and the Middle East 13,440 6.3
Asia and Pacific 111,739 52.2
South America 8,898 4.2
United States 6,084 2.8
Europe and the United Kingdom 51,945 24.3
North/Central America 7,781 3.6
Caribbean/Antilles 11,689 5.5
Others 2,654 1.2
Total 214,230 100
PERMANENT RESIDENTS IN YEAR 1991
SOURCE COUNTRY NUMBER PERCENTAGE RANK
Hong Kong 22,340 9.7 1
Poland 15,731 6.8 2
China 13,915 6.0 3
India 12,848 5.6 4
Philippines 12,335 5.3 5
Lebanon 11,987 5.2 6
Vietnam 8,963 3.9 7
United Kingdom 7,543 3.3 8
El Salvador 6,977 3.0 9
Sri Lanka 6,826 3.0 10
TOTAL — TOP 10 119,465 51.8
TOTAL — OTHERS 111,316 48.2
GRAND TOTAL 230,781 100
PERMANENT RESIDENTS ADMITTED BY REGION IN 1991
REGION NUMBER PERCENTAGE
Africa and the Middle East 16,087 7.0
Asia and Pacific 119,955 52.0
South America 10,582 4.6
United States 6,597 2.9
Europe and the United Kingdom 48,055 20.8
North/Central America 13,404 5.8
Caribbean/Antilles 12,922 5.6
Others 3,179 1.4
Total 230,781 100
PERMANENT RESIDENTS IN YEAR 1992
SOURCE COUNTRY NUMBER PERCENTAGE RANK
Hong Kong 38,910 15.4 1
Philippines 13,273 5.2 2
India 12,675 5.0 3
Sri Lanka 12,635 5.0 4
Poland 11,878 4.7 5
China 10,429 4.1 6
Vietnam 7,681 3.2 7
United States 7,537 3.0 8
Taiwan 7,456 2.9 9
United Kingdom 7,138 2.8 10
TOTAL — TOP 10 129,612 51.3
TOTAL — OTHERS 123,230 48.7
GRAND TOTAL 252,842 100
PERMANENT RESIDENTS ADMITTED BY REGION IN 1992
REGION NUMBER PERCENTAGE
Africa and the Middle East 19,633 7.7
Asia and Pacific 139,216 54.4
South America 10,389 4.1
United States 7,537 2.9
Europe and the United Kingdom 44,871 17.5
North/Central America 12,526 4.9
Caribbean/Antilles 14,952 5.8
Others 3,718 1.5
Total 252,842 100
PERMANENT RESIDENTS IN YEAR 1993
SOURCE COUNTRY NUMBER PERCENTAGE RANK
Hong Kong 36,574 14.3 1
India 20,472 8.0 2
Philippines 19,772 7.7 3
Taiwan 9,867 3.9 4
China 9,466 3.7 5
Sri Lanka 9,103 3.6 6
Vietnam 8,301 3.2 7
United States 8,014 3.1 8
United Kingdom 7,159 2.8 9
Poland 6,877 2.7 10
TOTAL — TOP 10 135,605 53.0
TOTAL — OTHERS 120,214 47.0
GRAND TOTAL 255,819 100
PERMANENT RESIDENTS ADMITTED BY REGION IN 1993
REGION NUMBER PERCENTAGE
Africa and the Middle East 16,918 6.6
Asia and Pacific 147,323 57.6
South America 9,580 3.7
United States 8,014 3.1
Europe and the United Kingdom 46,602 18.2
North/Central America 7,737 3.0
Caribbean/Antilles 16,563 6.5
Others 3,082 1.2
Total 255,819 100
PERMANENT RESIDENTS IN YEAR 1994
SOURCE COUNTRY NUMBER PERCENTAGE RANK
Hong Kong 44,169 19.7 1
Philippines 19,097 8.5 2
India 17,225 7.7 3
China 12,486 5.6 4
Taiwan 7,411 3.3 5
Sri Lanka 6,671 3.0 6
United States 6,234 2.8 7
Vietnam 6,230 2.8 8
United Kingdom 5,971 2.8 9
Bosnia-Hercegovina 4,905 2.2 10
TOTAL — TOP 10 130,399 58.2
TOTAL — OTHERS 93,476 41.8
GRAND TOTAL 223,875 100
PERMANENT RESIDENTS ADMITTED BY REGION IN 1994
REGION NUMBER PERCENTAGE
Africa and the Middle East 13,706 6.1
Asia and Pacific 141,587 63.2
South America 7,919 3.5
United States 6,234 2.8
Europe and the United Kingdom 38,641 17.3
North/Central America 3,503 1.6
Caribbean/Antilles 9,980 4.5
Others 2,215 1.0
Total 223,875 100
PERMANENT RESIDENTS IN YEAR 1995
SOURCE COUNTRY NUMBER PERCENTAGE RANK
Hong Kong 31,746 14.9 1
India 16,215 7.6 2
Philippines 15,149 7.1 3
China 13,291 6.3 4
Sri Lanka 8,926 4.2 5
Taiwan 7,691 3.6 6
Bosnia-Hercegovina 6,270 3.0 7
United Kingdom 6,161 2.9 8
United States 5,185 2.4 9
Pakistan 3,996 1.9 10
TOTAL — TOP 10 114,630 53.9
TOTAL — OTHERS 97,874 46.1
GRAND TOTAL 212,504 100
PERMANENT RESIDENTS ADMITTED BY REGION IN 1995
REGION NUMBER PERCENTAGE
Africa and the Middle East 14,631 6.9
Asia and Pacific 129,106 60.8
South America 7,538 3.5
United States 5,185 2.4
Europe and the United Kingdom 41,266 19.4
North/Central America 2,842 1.3
Caribbean/Antilles 10,056 4.5
Others 1,880 0.8
Total 212,504 100
PERMANENT RESIDENTS IN YEAR 1996
SOURCE COUNTRY NUMBER PERCENTAGE RANK
Hong Kong 29,966 13.3 1
India 21,276 9.4 2
China 17,516 7.8 3
Taiwan 13,207 5.8 4
Philippines 13,132 5.8 5
Pakistan 7,753 3.4 6
Sri Lanka 6,151 2.7 7
United States 5,837 2.6 8
Iran 5,828 2.6 9
United Kingdom 5,585 2.5 10
TOTAL — TOP 10 126,251 55.9
TOTAL — OTHERS 99,522 44.1
GRAND TOTAL 225,773 100
PERMANENT RESIDENTS ADMITTED BY REGION IN 1996
REGION NUMBER PERCENTAGE
Africa and the Middle East 36,503 16.15
Asia and Pacific 124,771 55.20
South and Central America 18,878 8.35
United States 5,869 2.60
Europe and the United Kingdom 40,009 17.70
Not Stated 20 0.01
Total 225,773 100
PERMANENT RESIDENTS IN YEAR 1997
SOURCE COUNTRY NUMBER PERCENTAGE RANK
Hong Kong 22,242 10.30 1
India 19,614 9.08 2
China 18,530 8.58 3
Taiwan 13,321 6.17 4
Pakistan 11,233 5.20 5
Philippines 10,873 5.03 6
Iran 7,477 3.46 7
Sri Lanka 5,069 2.35 8
United States 5,043 2.33 9
United Kingdom 4,659 2.16 10
TOTAL — TOP 10 118,061 54.65
TOTAL — OTHERS 97,983 45.35
GRAND TOTAL 216,044 100
PERMANENT RESIDENTS ADMITTED BY REGION IN 1997
REGION NUMBER PERCENTAGE
Africa and the Middle East 37,794 17.49
Asia and Pacific 117,076 54.19
South and Central America 17,425 8.07
United States 5,043 2.33
Europe and the United Kingdom 38,673 17.90
Not Stated 33 0.02
Total 216,044 100
PERMANENT RESIDENTS IN YEAR 1998
SOURCE COUNTRY NUMBER PERCENTAGE RANK
China 19,749 11.34 1
India 11.34 8.80 2
Philippines 8,172 4.69 3
Hong Kong 8,083 4.64 4
Pakistan 8,081 4.64 5
Taiwan 7,164 4.11 6
Iran 6,772 3.89 7
South Korea 4,910 2.82 8
United States 4,764 2.74 9
Russia 4,299 2.47 10
TOTAL — TOP 10 87,321 50.16
TOTAL — OTHERS 86,779 49.84
GRAND TOTAL 174,100 100
PERMANENT RESIDENTS ADMITTED BY REGION IN 1998
REGION NUMBER PERCENTAGE
Africa and the Middle East 32,534 18.69
Asia and Pacific 84,036 48.27
South and Central America 14,003 8.04
United States 4,764 2.74
Europe and the United Kingdom 38,477 22.10
Not Stated 286 0.16
Total 174,100 100

Source for 1995/1996:
Source for 1996-1998

Are things starting to make sense? Immigration policies for the last 50+ years have focused on Asians and Africans, replacing (to a large degree) the overwhelmingly European makeup that was Canada for many years.

Of course, speaking up about what’s apparent will lead to cries of racism.

One thing people really need to get clear: so-called “conservatives” have no interest whatsoever in preserving demographics or the makeup of a country. They fully support the genocide agenda, but try to pitch it from a more economic perspective.

White replacement is a very real thing. Only the most obtuse or unobservant cannot see what’s going on, especially given how blatant it is..

While Liberals are generally quite open for their disdain of Europeans, “Conservatives” behave in a stealthier and more subversive manner. They camouflage their true intentions, making them more dangerous.

A little self promotion: Borderless Canada is still available online. Learn about what’s been going on in this country. Virtually all major issues can be directly tied to immigration and border security, and it’s not racist or bigoted to discuss these hard truths.

3. Documents Provided By Canadian Government

(A.0) https://epe.lac-bac.gc.ca/100/202/301/immigration_statistics-ef/index.html
(A.1) https://epe.lac-bac.gc.ca/100/202/301/immigration_statistics-ef/mp22-1_1966.pdf
Canada Immigration Statistics 1966
(A.2) https://epe.lac-bac.gc.ca/100/202/301/immigration_statistics-ef/mp22-1_1967.pdf
Canada Immigration Statistics 1967
(A.3) https://epe.lac-bac.gc.ca/100/202/301/immigration_statistics-ef/mp22-1_1968.pdf
Canada Immigration Statistics 1968
(A.4) https://epe.lac-bac.gc.ca/100/202/301/immigration_statistics-ef/mp22-1_1969.pdf
Canada Immigration Statistics 1969
(A.5) https://epe.lac-bac.gc.ca/100/202/301/immigration_statistics-ef/mp22-1_1970.pdf
Canada Immigration Statistics 1970
(A.6) https://epe.lac-bac.gc.ca/100/202/301/immigration_statistics-ef/mp22-1_1971.pdf
Canada Immigration Statistics 1971
(A.7) https://epe.lac-bac.gc.ca/100/202/301/immigration_statistics-ef/mp22-1_1972.pdf
Canada Immigration Statistics 1972
(A.8) https://epe.lac-bac.gc.ca/100/202/301/immigration_statistics-ef/mp22-1_1973.pdf
Canada Immigration Statistics 1973
(A.9) https://epe.lac-bac.gc.ca/100/202/301/immigration_statistics-ef/mp22-1_1974.pdf
Canada Immigration Statistics 1974
(A.10) https://epe.lac-bac.gc.ca/100/202/301/immigration_statistics-ef/mp22-1_1975.pdf
Canada Immigration Statistics 1975
(A.11) https://epe.lac-bac.gc.ca/100/202/301/immigration_statistics-ef/mp22-1_1976.pdf
Canada Immigration Statistics 1976
(A.12) https://epe.lac-bac.gc.ca/100/202/301/immigration_statistics-ef/mp22-1_1977.pdf
Canada Immigration Statistics 1977
(A.13) https://epe.lac-bac.gc.ca/100/202/301/immigration_statistics-ef/mp22-1_1978.pdf
Canada Immigration Statistics 1978
(A.14) https://epe.lac-bac.gc.ca/100/202/301/immigration_statistics-ef/mp22-1_1979.pdf
Canada Immigration Statistics 1979
(A.15) https://epe.lac-bac.gc.ca/100/202/301/immigration_statistics-ef/mp22-1_1980.pdf
Canada Immigration Statistics 1980
(A.16) https://epe.lac-bac.gc.ca/100/202/301/immigration_statistics-ef/mp22-1_1981.pdf
Canada Immigration Statistics 1981
(A.17) https://epe.lac-bac.gc.ca/100/202/301/immigration_statistics-ef/mp22-1_1982.pdf
Canada Immigration Statistics 1982
(A.18) https://epe.lac-bac.gc.ca/100/202/301/immigration_statistics-ef/mp22-1_1983.pdf
Canada Immigration Statistics 1983
(A.19) https://epe.lac-bac.gc.ca/100/202/301/immigration_statistics-ef/mp22-1_1984.pdf
Canada Immigration Statistics 1984
(A.20) https://epe.lac-bac.gc.ca/100/202/301/immigration_statistics-ef/mp22-1_1985.pdf
Canada Immigration Statistics 1985
(A.21) https://epe.lac-bac.gc.ca/100/202/301/immigration_statistics-ef/mp22-1_1986.pdf
Canada Immigration Statistics 1986
(A.22) https://epe.lac-bac.gc.ca/100/202/301/immigration_statistics-ef/mp22-1_1987.pdf
Canada Immigration Statistics 1987
(A.23) https://epe.lac-bac.gc.ca/100/202/301/immigration_statistics-ef/mp22-1_1988.pdf
Canada Immigration Statistics 1988
(A.24) https://epe.lac-bac.gc.ca/100/202/301/immigration_statistics-ef/mp22-1_1989.pdf
Canada Immigration Statistics 1989
(A.25) https://epe.lac-bac.gc.ca/100/202/301/immigration_statistics-ef/mp22-1_1990.pdf
Canada Immigration Statistics 1990
(A.26) https://epe.lac-bac.gc.ca/100/202/301/immigration_statistics-ef/mp22-1_1991.pdf
Canada Immigration Statistics 1991
(A.27) https://epe.lac-bac.gc.ca/100/202/301/immigration_statistics-ef/mp22-1_1992.pdf
Canada Immigration Statistics 1992
(A.28) https://epe.lac-bac.gc.ca/100/202/301/immigration_statistics-ef/mp22-1_1993.pdf
Canada Immigration Statistics 1993
(A.29) https://epe.lac-bac.gc.ca/100/202/301/immigration_statistics-ef/mp22-1_1994.pdf
Canada Immigration Statistics 1994
(A.30) https://epe.lac-bac.gc.ca/100/202/301/immigration_statistics-ef/mp22-1_1995.pdf
Canada Immigration Statistics 1995
(A.31) https://epe.lac-bac.gc.ca/100/202/301/immigration_statistics-ef/mp22-1_1996.pdf
Canada Immigration Statistics 1996

(B.0) https://publications.gc.ca/site/eng/9.505817/publication.html
https://www.canada.ca/en/immigration-refugees-citizenship/corporate/reports-statistics/statistics-open-data.html
(B.1) https://publications.gc.ca/collections/collection_2010/cic/MP43-333-1999-eng.pdf
Canada Immigration Facts And Figures 1998
(B.2) https://publications.gc.ca/collections/Collection/MP43-333-2000E.pdf

(C.0) Parliament Report Index
http://archive.is/vwM6G
(C.1) 2004 Report to Canadian Parliament
2004.annual.immigration.report.to.parliament
(C.2) 2005 Report to Canadian Parliament
2005.annual.immigration.report.to.parliament
(C.3) 2006 Report to Canadian Parliament
2006.annual.immigration.report.to.parliament
(C.4) 2007 Report to Canadian Parliament
2007.annual.immigration.report.to.parliament
(C.5) 2008 Report to Canadian Parliament
2008.annual.immigration.report.to.parliament
(C.6) 2009 report to Canadian Parliament
2009.annual.immigration.report.to.parliament
(C.7) 2010 Report to Canadian Parliament
2010.annual.immigration.report.to.parliament
(C.8) 2011 Report to Canadian Parliament
2011.annual.immigration.report.to.parliament
(C.9) 2012 Report to Canadian Parliament
2012.annual.immigration.report.to.parliament
(C.10) 2013 Report to Canadian Parliament
2013.annual.immigration.report.to.parliament
(C.11) 2014 Report to Canadian Parliament
2014.annual.immigration.report.to.parliament
(C.12) 2015 Report to Canadian Parliament
2015.annual.immigration.report.to.parliament
(C.13) 2016 Report to Canadian Parliament
2016.annual.immigration.report.to.parliament
(C.14) 2017 Report to Canadian Parliament
2017.annual.immigration.report.to.parliament
(C.15) 2018 Report to CDN Parliament
2018.annual.immigration.report.to.parliament
(C.15.2) 2019-2021 Supplemental Report
http://archive.is/onyev
(C.16) 2019 Report to Canadian Parliament
2019.annual.immigration.report.to.parliament
(C.17) 2020 Report to Canadian Parliament
2020.annual.immigration.report.to.parliament
(C.18) 2021 Report to Canadian Parliament
2021.annual.immigration.report.to.parliament

Canada Before 1970: Growing A Population Without Replacing It

In Western societies, there seems to be the mentality that populations must always grow. Furthermore, large numbers of people from very different backgrounds should be brought in to make this happen. At least, this is what public figures and media heads say, regardless of what the citizens want.

That being said, this “diversity” push is something that has only existed for the last 50 years or so. Before that, there was a focus on maintaining the demographic makeup. Let’s take a look.

A good starting place would be to see how many people are coming to Canada every year. Although this doesn’t tell the entire story, the numbers of Permanent Residents is a good place to start.

YEAR PERMANENT RESIDENTS % OF POPULATION
1852 29,307
1853 29,464
1854 37,263
1855 25,296
1856 22,544
1857 33,854
1858 12,339
1859 6,300
1860 6,276 0.2
1861 13,589 0.4
1862 18,294 0.6
1863 21,000 0.6
1864 24,779 0.7
1865 18,958 0.6
1866 11,427 0.3
1867 10,666 0.3
1868 12,765 0.4
1869 18,630 0.5
1870 24,706 0.7
1871 27,773 0.8
1872 36,578 1.0
1873 50,050 1.3
1874 39,373 1.0
1875 27,382 0.7
1876 25,633 0.6
1877 27,082 0.7
1878 29,807 0.7
1879 40,492 1.0
1880 38,505 0.9
1881 47,991 1.1
1882 112,458 2.6
1883 133,624 3.0
1884 103,824 2.3
1885 76,169 1.7
1886 69,152 1.5
1887 84,526 1.8
1888 88,766 1.9
1889 91,600 1.9
1890 75,067 1.6
1891 82,165 1.7
1892 30,996 0.6
1893 29,633 0.6
1894 20,829 0.4
1895 18,790 0.4
1896 16,835 0.3
1897 21,716 0.4
1898 31,900 0.6
1899 44,543 0.9
1900 41,681 0.8
1901 55,747 1.0
1902 89,102 1.6
1903 138,660 2.5
1904 131,252 2.3
1905 141,465 2.4
1906 211,653 5.3
1907 272,409 4.2
1908 143,326 2.2
1909 173,694 2.6
1910 286,839 4.1
1911 331,288 4.6
1912 375,756 5.1
1913 400,870 5.3
1914 150,484 1.9
1915 33,665 0.4
1916 55,914 0.7
1917 72,910 0.9
1918 41,845 0.5
1919 107,698 1.3
1920 138,824 1.6
1921 91,728 1.0
1922 64,224 0.7
1923 133,729 1.5
1924 124,164 1.4
1925 84,907 0.9
1926 135,982 1.4
1927 158,886 1.6
1928 166,783 1.7
1929 164,993 1.6
1930 104,806 1.0
1931 27,530 0.3
1932 20,591 0.2
1933 14,382 0.1
1934 12,476 0.1
1935 11,277 0.1
1936 11,643 0.1
1937 15,101 0.1
1938 17,244 0.2
1939 16,994 0.2
1940 11,324 0.1
1941 9,329 0.1
1942 7,576 0.1
1943 8,504 0.1
1944 12,801 0.1
1945 22,722 0.2
1946 71,719 0.6
1947 64,127 0.5
1948 125,414 1.0
1949 95,217 0.7
1950 73,912 0.5
1951 194,391 1.4
1952 164,498 1.1
1953 168,868 1.1
1954 154,227 1.0
1955 109,946 0.7
1956 164,857 1.0
1957 282,164 1.7
1958 124,851 0.7
1959 106,928 0.6
1960 104,111 0.6
1961 71,698 0.4
1962 74,856 0.4
1963 93,151 0.5
1964 112,606 0.6
1965 146,758 0.7
1966 194,743 1.0
1967 222,876 1.1
1968 183,974 0.9
1969 164,531 0.8
1970 147,713 0.7
1971 121,900 0.6
1972 122,006 0.6
1973 184,200 0.8
1974 218,465 1.0
1975 187,881 0.8
1976 149,429 0.6
1977 114,914 0.5
1978 86,313 0.4
1979 112,093 0.5
1980 43,137 0.6
1981 128,641 0.5
1982 121,175 0.5
1983 89,186 0.4
1984 88,272 0.3
1985 84,347 0.3
1986 99,355 0.4
1987 152,079 0.6
1988 161,588 0.6
1989 191,555 0.7
1990 86,452 0.6
1991 232,806 0.8
1992 254,790 0.9
1993 256,641 0.9
1994 224,385 0.8
1995 212,865 0.7
1996 226,071 0.8
1997 216,035 0.7
1998 174,195 0.6
1999 189,951 0.6
2000 227,456 0.7
2001 250,637 0.8
2002 229,048 0.7
2003 221,349 0.7
2004 235,823 0.7
2005 262,242 0.8
2006 251,640 0.8
2007 236,753 0.7
2008 247,247 0.7
2009 252,172 0.7
2010 280,689 0.8
2011 248,748 0.7
2012 257,887 0.7

Source for this chart is that data provided on page 3. Also, data for some earlier years is provided by Statistics Canada.

Even though large numbers of people have been coming to Canada for a long time, there was still a lot of social cohesion. This is because migrants were primarily selected from countries with a very similar makeup and composition.

Historically, the numeric predominance of those of British and French origin was unquestionable. Before the great wave of European migration to Canada between 1896 and the beginning of the First World War, Canada’s population was indeed mainly made up of those of British and French origin. For example, the 1871 Census of Canada shows that 60 percent of Canada’s 3.5 million people were of British origin, and 30 percent French origin; Europeans not of British nor French origin accounted for only 7 percent of Canada’s population in 1871 as well as in 1881 (Kalbach, 1990: 24). This demographic composition basically persisted until the turn of the century.

The wave of immigration to Canada prior to the First World War began to increase the stock of Europeans not from British or French origin. Between 1896 and 1914, over three million immigrants came to Canada. When the supply of emigrants from England and Western Europe was dwindling, Canada began accepting people from Eastern and Southern Europe, including Poles, Ukrainians, Hutterites and Doukhobors. In the period between the two world wars from 1915 to 1945, another two million immigrants came to Canada (Statistics Canada, 1983: A125-163).

The census data of Canada indicate that Canadians of European origin other than British and French increased from 8.5 percent of the total population in 1901 to 14.2 percent in 1921, and to 17.8 percent in 1941 (Kalbach, 1990: 24). In contrast, Canadians of British origin declined in relative terms from 57 percent of the total population in 1901 to 50 percent in 1941, but those of French origin remained at around 30 percent of the total population in 1901 and in 1941. In short, if the composition of Canadians of European origin other than British and French is used as an indicator of ethnic plurality, then there was an increase in diversity between 1901 and 1941. However, Canada’s population in 1941, as in 1871, was made up of people mainly of European origin, which accounted for 98 percent of the total population in 1941 and in 1871, despite the fact that the population had increased from 3.5 million people in 1871 to 11.5 million people in 1941.

The Government of Canada openly admits that traditionally, the bulk of immigration came from Europe. More specifically, it came from the West, from places like Britain and France. (See archive).

And what was the result of this? Very little in terms of enclaves or balkanization. The population grew, but without the genocidal “multicultural” push that goes around now. This type of system focused on cultural compatibility, something that would be unthinkable today.

TIME PERIOD REGION # OF MIGRANTS % OF TOTAL
1968-1972 Europe 387,670 52.6
United States 114,615 15.5
Central/South America 24,863 3.4
Carribean 53,100 7.2
Asia 112,584 15.3
Africa 22,014 3
Australia 18,656 2.5
Oceania 0 0
Not Stated 3,622 0.5
Total 737,124 100
1973-1977 Europe 324,131 37.9
United States 102,141 11.9
Central/South America 63,598 7.4
Asia 216,837 25.4
Africa 42,748 5
Australia 10,870 1.3
Oceania 7,937 0.9
Not Stated 0 0
Total 854,889 100
1978-1982 Europe 196,546 33.2
United States 49,407 8.4
Central/South America 36,262 6.1
Carribean 39,362 6.7
Asia 236,596 40
Africa 21,946 3.7
Australia 6,438 1.1
Oceania 4,502 0.8
Not Stated 232 0
Total 591,291 100
1983-1987 Europe 124.344 24.42
United States 36,214 7.1
Central/South America 56,442 11
Carribean 39,079 7.6
Asia 226,326 44.1
Africa 24,027 4.7
Australia 2,774 0.5
Oceania 3,771 0.7
Not Stated 38 0
Total 513,015 100
1988-1992 Europe 237,666 22.6
United States 33,686 3.2
Central/South America 91,061 8.7
Carribean 59,911 5.7
Asia 545,410 51.9
Africa 70,744 6.7
Australia 4,771 0.5
Oceania 8,534 0.8
Not Stated 0 0
Total 1,051,783 100
1993-1995 Europe 126,509 18.3
United States 19,433 2.8
Central/South America 39,199 5.7
Carribean 36,599 5.3
Asia 418,016 60.4
Africa 45,255 6.5
Australia 3,476 0.5
Oceania 3,791 0.5
Not Stated 0 0
Total 692,198 100

The Government’s own data tables show just how rapidly the source countries have been shifting. While immigration to Canada used to mainly be from Europe, it’s now overwhelmingly Asian. Looking at the Annual Immigration Reports to Parliament in recent years, this trend has only gotten worse.

Now, were the voters ever asked if they wanted to become minorities?

Article I
The Contracting Parties confirm that genocide, whether committed in time of peace or in time of war, is a crime under international law which they undertake to prevent and to punish.

Article II
In the present Convention, genocide means any of the following acts committed with intent to destroy, in whole or in part, a national, ethnical, racial or religious group, as such:
(a) Killing members of the group;
(b) Causing serious bodily or mental harm to members of the group;
(c) Deliberately inflicting on the group conditions of life calculated to bring about its physical destruction in whole or in part;
(d) Imposing measures intended to prevent births within the group;
(e) Forcibly transferring children of the group to another group.

Article III
The following acts shall be punishable:
(a) Genocide;
(b) Conspiracy to commit genocide;
(c) Direct and public incitement to commit genocide;
(d) Attempt to commit genocide;
(e) Complicity in genocide.

Article IV
Persons committing genocide or any of the other acts enumerated in article III shall be punished, whether they are constitutionally responsible rulers, public officials or private individuals.

A Government doesn’t have to round up and execute its citizens in order to commit genocide. Another way is to flood the country with large numbers of very different people, with the purpose and intent of diluting and erasing the host population. Instead of having a national identity, society becomes “multicultural”.

One caveat of course: the people coming in are encouraged to maintain their own identities, customs, traditions, and language. The populations being replaced are expected to endlessly accommodate that.

If a larger population is needed, it’s entirely possible to grow it organically. However, modern efforts across the West can best be explained as attempting to erase groups entirely.

A little self promotion: Borderless Canada is still available online. Learn about what’s been going on in this country. Virtually all major issues can be directly tied to immigration and border security, and it’s not racist or bigoted to discuss these hard truths.

(1) https://publications.gc.ca/collections/collection_2013/cic/Ci1-8-2012-eng.pdf
(2) https://www12.statcan.gc.ca/census-recensement/2011/as-sa/98-310-x/2011003/fig/fig3_1-2-eng.cfm
(3) https://justice.gc.ca/eng/rp-pr/csj-sjc/jsp-sjp/rp02_8-dr02_8/t2.html
(4) https://archive.ph/QkUeu
(5) https://justice.gc.ca/eng/rp-pr/csj-sjc/jsp-sjp/rp02_8-dr02_8/p2.html
(6) https://archive.ph/PzcO3
(7) https://www.un.org/en/genocideprevention/genocide-convention.shtml
(8) https://www.un.org/en/genocideprevention/documents/atrocity-crimes/Doc.1_Convention%20on%20the%20Prevention%20and%20Punishment%20of%20the%20Crime%20of%20Genocide.pdf
(9) UN Convention On Punishing And Preventing Genocide

M-44: Parliament Votes To Accelerate TFW/Student-To-PR Pipeline

Motion M-44 has recently passed. The House of Commons voted to demand that the Trudeau Government come up with new ways to accelerate the transition of “temporary” foreign workers and international students into Permanent Residents.

The legislation was advanced by Liberal Randeep Sarai. This isn’t at all surprising, considering the largest group coming to Canada in recent years has been Indians.

The final vote was 324-0. This means each Member of Parliament who voted did so in favour of this Motion, regardless of partisan affiliation. Every single “Conservative” voted in favour of speeding up demographic replacement by supporting this.

Even worse: they condemn the truthful description of what’s happening as racist conspiracy theories.

It’s interesting that there’s no hurry by Federal politicians to get rid of masks or vaccine passports. However, all of Parliament agreed that there should be a plan within the next 4 months to expand and speed up pathways to creating more Permanent Residents.

MOTION TEXT
That, in the opinion of the House, the government should develop and publicly release within 120 days following the adoption of this motion a comprehensive plan to expand the economic immigration stream to allow workers of all skill levels to meet the full range of labour needs and pathways to permanent residency for temporary foreign workers, including international students, with significant Canadian work experience in sectors with persistent labour shortages, and such plan should incorporate the following elements:
.
(a) amending eligibility criteria under economic immigration programs to give more weight to significant in-Canada work experience and expand the eligible occupational categories and work experience at various skills levels;
.
(b) examining evidence and data gathered from recent programs such as Temporary Resident to Permanent Resident Pathway, Atlantic Immigration Program (AIP), Rural and Northern Immigration Program (RNIP), and Agri-Food Pilot, and Provincial Nominee Process (PNP);
.
(c) incorporating data on labour market and skills shortages to align policy on immigrant-selection with persistent labour gaps;
.
(d) assessing ways to increase geographic distribution of immigration and encourage immigrant retention in smaller communities, as well as increase Francophone immigration outside Quebec;
.
(e) identifying mechanisms for ensuring flexibility in immigration-selection tools to react quicker to changes in labour market needs and regional economic priorities; and
.
(f) specifically considering occupations and essential sectors that are underrepresented in current economic immigration programs, such as health services, caregivers, agriculture, manufacturing, service industry, trades, and transportation.

What specific sectors will be targeted? Included are: health services, caregivers, agriculture, manufacturing, service industry, trades, and transportation. Of course, it’s much easier to support a family if they are living in a country with a much lower cost of living.

Sure, one could argue that it’s just to demand a plan. However, Trudeau is extremely accommodating when it comes to finding new ways to bring people into Canada.

Another development saw the Government extend the work visas for graduates get extended by 18 months. Now, students who complete a diploma or degree are typically eligible for a 3 year open work visa (via the Post Graduate Work Program). For those involved, it effectively makes those permits 4 1/2 years. It’s unclear if this is just a one-off.

In 2020, the Government quietly made changes to allow people on student visas to work an unlimited amount of hours — while still in school. This policy existed to ensure that students were in fact focused on studying, and not just using it as a backdoor work permit. See page 12 of 2021 Report. Guess we’ll see if it ever goes back.

It seems unlikely that the average Canadian has any idea just how many students and “temporary” workers come to Canada. This should demonstrate the trend, at least for recent years.

Year Stu TFWP IMP Total
2003 61,293 82,151 143,444

2004 56,536 90,668 147,204

2005 57,476 99,146 156,622

2006 61,703 112,658 174,361

2007 64,636 165,198 229,834

2008 79,509 192,519 272,028

2009 85,140 178,478 263,618

2010 96,157 182,276 278,433

2011 98,383 190,842 289,225

2012 104,810 213,573 318,383

2013 111,865 221,310 333,175

2014 127,698 95,086 197,924 420,078

2015 219,143 73,016 175,967 468,126

2016 265,111 78,402 207,829 551,342

2017 317,328 78,788 224,033 620,149

2018 356,876 84,229 255,034 696,139

2019 402,427 98,310 306,797 807,534

2020 256,740 84,609 242,130 583,452

Stu = Student Visa
TFWP = Temporary Foreign Worker Program
IMP = International Mobility Program

Data for this table was compiled from the Annual Immigration Reports to Parliament, from 2004 through 2021. These cover the years 2003 to 2020. Keep in mind, this is just what’s on the books.

How many of them actually stay? It’s hard to say. Either the Government doesn’t keep data on this this, or they do, but just don’t make it easily available.

About the change from 2013 to 2014: the Harper Government got a lot of flack for flooding Canada with TFWs. The solution they came up with was not to reduce the number of them. Instead, they broke up the program into different areas to better conceal what was happening. This has been addressed elsewhere on this site.

Simply beyond pumping up the people who are getting PR status, the Canadian Parliament has also been holding hearings since February on the topic of boosting the number of international students coming in the first place.

More people coming + more staying = faster rate of change

The lie has been heavily promoted that it’s only 300,000 or 400,000 people coming to Canada per year. It’s not. Whether it’s ignorance or malice, very few report the truth, including those in alternative media. Here’s a recent review of the numbers in Canada. It’s shocking, or at least it should be.

While politicians here facilitate open borders, it’s worth mentioning that over 4.2 million babies have been aborted since 1970. Then of course, they’re feminism and the globohomo agenda doing a number on birth rates. The solution then becomes to bring more people over, to compensate for a declining population.

Are things starting to make sense now?

A little self promotion: Borderless Canada is still available online. Learn about what’s been going on in this country. Virtually all issues can be directly tied to immigration and border security, and it’s not racist to discuss hard truths.

(1) https://www.ourcommons.ca/members/en/89339/motions/11528727
(2) https://www.ourcommons.ca/members/en/randeep-sarai(89339)
(3) https://www.ourcommons.ca/Members/en/votes/44/1/85
(4) https://www.ourcommons.ca/Committees/en/CIMM/StudyActivity?studyActivityId=11473703
(5) https://kitchener.citynews.ca/national-news/federal-government-will-let-international-graduates-stay-in-canada-another-18-months-5291183
(6) https://www.cp24.com/news/tory-leadership-candidate-pierre-poilievre-denounces-white-replacement-theory-1.5906421

2004.annual.immigration.report.to.parliament
2005.annual.immigration.report.to.parliament
2006.annual.immigration.report.to.parliament
2007.annual.immigration.report.to.parliament
2008.annual.immigration.report.to.parliament
2009.annual.immigration.report.to.parliament
2010.annual.immigration.report.to.parliament
2011.annual.immigration.report.to.parliament
2012.annual.immigration.report.to.parliament
2013.annual.immigration.report.to.parliament
2014.annual.immigration.report.to.parliament
2015.annual.immigration.report.to.parliament
2016.annual.immigration.report.to.parliament
2017.annual.immigration.report.to.parliament
2018.annual.immigration.report.to.parliament
2019.annual.immigration.report.to.parliament
2020.annual.immigration.report.to.parliament
2021.annual.immigration.report.to.parliament

Eugenics In Canada: 20% Of Babies Aborted In “Pro-Choice Movement”

Ever wonder just how much of the Canadian public has been lost due to “abortion” in recent decades? Considering the size and scale of this, it must be good business.

According to a compilation of data from the Federal Government, approximately 20% of pregnancies have ended in abortion. Of course, this relies on transparent reporting, so the number could be much higher. These totals exclude miscarriages and stillbirths.

For a good source on this data, visit Love4Life. There is a considerable amount of statistical data compiled, and it connects back to official Government sources.

Now, there are going to be some discrepancies in the data. This is partly because of incomplete reporting, and also because some sources have different numbers. Nonetheless, it should paint the picture quite gruesomely.

Let’s drop the spoiler here: there were over 4,222,858 abortions between 1970 and 2020. This isn’t a joke. Our “pro-choice” supporters and policies have literally killed millions of Canadians.

It’s also quite interesting that many of the same people are behind two (seemingly) opposing ideologies within Western countries. Then again, population replacement is just some racist conspiracy theory.

[1] Promote widespread abortion locally
[2] Promote mass immigration to counter falling birth rates

Anyhow, let’s look at some of these numbers:

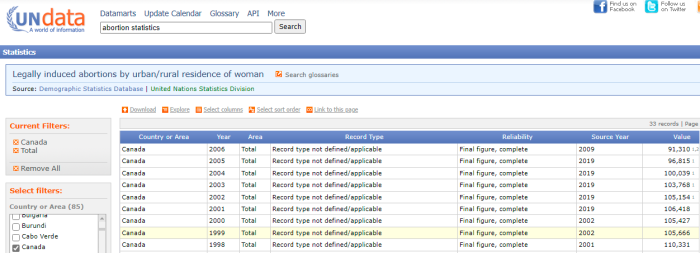
*** The U.N. has some data prior to 1974, so that’s added in:

YEAR ABORTIONS
1970 11,200
1971 30,923
1973 43,201
1974 52,435
1975 53,705
1976 58,712
1977 59,864
1978 66,710
1979 69,745
1980 72,099
1981 71,911
1982 75,071
1983 69,368
1984 69,449
1985 69,216
1986 69,572
1987 70,023
1988 72,693
1989 79,315
1990 92,901
1991 95,059
1992 102,085
1993 104,403
1994 106,255
1995 108,248
1996 111,659
1997 111,709
1998 110,331
1999 105,666
2000 105,427
2001 106,418
2002 105,154
2003 103,768
2004 100,039
2005 96,815
2006 91,310
2007 98,762
2008 95,876
2009 93,755
2010 *64,641
2011 108,844
2012 100,958
2013 102,446
2014 100,194
2015 100,104
2016 97,764
2017 94,030
2018 85,294
2019 83,576
2020 74,155

**Note: data is combined from CIHI and Statistics Canada. The Canadian Institute for Health Information does have considerable recent data on abortion in this country.

*2010 is considered incomplete, since there wasn’t reporting from Quebec.

The Abortion Rights Coalition of Canada also compiles recent statistics on abortion numbers here. (see archive). It’s actually pretty morbid to think about.

According to Statistics Canada, there were 1,375,774 abortions between the years of 1987 to 2000. This is a span of 14 years, and showed an average of about 98,000 abortions per year. This amounted to some 263 performed per day.

If we factor in the data from 1970 to 2020 (data from a few different tables), there were 4,222,858 abortions. This covers 51 years, and would be approximately 86,000 per year. Converted into daily totals, that means roughly 227 babies would have died, every single day.

Don’t worry, it’s about to get a lot more disgusting when the ages of the girls and women are taken into account. There are an awful lot of children getting abortions.

YEAR ABORTIONS UNKNOWN UNDER 15 15 TO 17 18 TO 19
1974 52,435 0 623 7,937 7,868
1975 53,705 0 650 8,135 8,038
1976 58,712 0 717 8,551 8,764
1977 59,864 0 697 8,684 9,051
1978 66,710 0 642 9,228 10,453
1979 69,745 0 694 9,661 10,827
1980 72,099 0 613 9,650 11,115
1981 71,911 0 607 8,954 10,785
1982 75,071 0 586 8,463 11,073
1983 69,368 0 561 7,150 9,568
1984 69,449 0 504 6,887 8,996
1985 69,216 0 554 6,658 8,525
1986 69,572 0 430 6,636 8,497
1987 70,023 0 433 6,411 8,587
1988 72,693 0 424 6,361 8,916
1989 79,315 0 452 6,446 9,755
1990 92,901 0 597 7,635 10,639
1991 95,059 0 495 7,722 10,492
1992 102,085 0 580 8,153 11,037
1993 104,403 1 659 8,249 11,740
1994 106,255 338 526 8,386 12,371
1995 108,248 2,242 545 7,887 12,388
1996 111,659 2,439 532 8,117 13,021
1997 111,709 3,547 511 8,175 12,458
1998 110,331 3,832 464 7,741 13,118
1999 105,666 232 464 7,253 13,357
2000 105,427 219 389 7,369 10,611
2001 106,418 33 412 7,222 12,746
2002 105,154 17 337 6,381 12,626
2003 103,768 14 302 5,785 11,871
2004 100,039 5 304 5,974 10,964
2005 96,815 2 284 5,588 10,477
2006 91,310 156 267 5,608 9,609

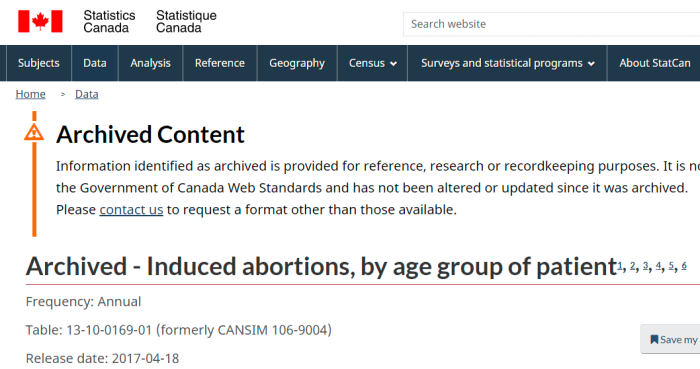
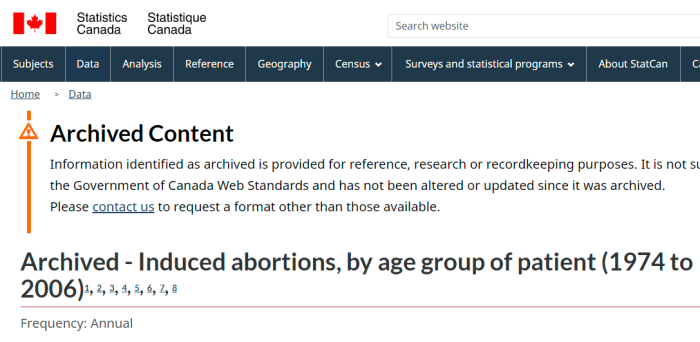
Data available from Statistics Canada: 1987 to 2000. Another version, which goes from 1974 to 2006, is also available. There are a few discrepancies, but the total is still shocking.

It’s also worth pointing out that starting in 1994, there were large numbers of women getting abortions for which there was no age listed. Just a hunch, but most of them were probably either in the country illegally, or didn’t want to disclose that they were minors.

Also, these are just “official” statistics. It’s very likely that there are a lot more abortions that have gone on, and are unreported. And recently:

induced-abortion-can-2015-en-web
induced-abortion-can-2016-en-web
induced-abortion-2017-en-web (1)
induced-abortions-reported-in-canada-in-2018-updated-data-tables-en-web
induced-abortions-reported-in-canada-in-2019-en (1)
induced-abortions-reported-in-canada-2020-en

There were 100,104 abortions reported in 2015.
There were 97,764 reported in 2016.
There were 94,030 reported in 2017.
There were 85,294 reported in 2018.
There were 83,576 reported in 2019.
There were 74,155 reported in 2020.

But don’t worry. There are no doubt countless politicians and public figures working diligently to reverse this trend, right?

And what do “conservatives” in Canada have to say about this? They don’t seem to care about the millions who’ve died as a result of abortion. There’s no ideological issue with infanticide in general. However, they insist that babies not be killed simply because of their sex. This was Bill C-233, a Private Member’s Bill in the last session.

There are also major demographic implications for abortion on this scale, which needs to be addressed as well.

The topic of births and deaths is certainly important to consider. That said, including abortion — especially being so widespread — changes the dynamics considerably.

Note: Difference = Live Births – Total Deaths
Note: Per Day = (Difference)/365 or 366

Year Birth Deaths Diff Day
1991 402,533 195,569 206,964 567
1992 398,643 196,535 202,108 552
1993 388,394 204,912 183,482 503
1994 385,114 207,077 178,037 488
1995 378,016 210,733 167,283 458
1996 366,200 212,880 153,320 419
1997 348,598 215,669 132,929 364
1998 342,418 218,091 124,327 341
1999 337,249 219,530 117,719 323
2000 327,882 218,062 109,820 300
2001 333,744 219,538 114,206 313
2002 328,802 223,603 105,199 288
2003 335,202 226,169 109,033 299
2004 337,072 226,584 110,488 302
2005 342,176 230,132 112,044 307
2006 354,617 228,079 126,538 347
2007 367,864 235,217 132,647 363
2008 377,886 238,617 139,269 381
2009 380,863 238,418 142,445 390
2010 377,213 240,075 137,138 376
2011 377,636 243,511 134,125 367
2012 381,869 246,596 135,273 370
2013 380,323 252,338 127,985 350
2014 384,100 258,821 125,279 343
2015 382,392 264,333 118,059 323
2016 383,102 267,213 115,889 318
2017 379,450 276,689 102,761 281
2018 375,390 283,706 91,684 251

A few years back, it was covered how Canada had a growing population even without immigration. In fairness, it’s not clear how much of this was due to birth tourism. However, the rates weren’t plummeting as people were led to believe.

A quick and dirty estimation (based on births and abortions) would be that approximately 20% of the pregnancies — excluding miscarriages — ended up being aborted. This translated to 1 in 5.

YEAR BIRTHS ABORTIONS B + A % ABORTED
1991 402,533 95,059 497,592 19.1%
1992 398,643 102,085 500,728 20.3%
1993 388,394 104,403 492,797 21.2%
1994 385,114 106,255 491,369 21.6%
1995 378,016 108,248 486,264 22.3%
1996 366,200 111,659 477,859 23.3%
1997 348,598 111,709 460,307 24.3%
1998 342,418 110,331 452,749 24.4%
1999 337,249 105,666 442,915 23.8%
2000 327,882 105,427 433,309 24.3%
2001 333,744 106,418 440,162 24.2%
2002 328,802 105,154 433,956 24.2%
2003 335,202 103,768 438,970 23.6%
2004 337,072 100,039 447,111 22.4%
2005 342,176 96,815 438,991 22.0%
2006 354,617 91,310 445,927 20.5%
2007 367,864 98,762 466,626 21.2%
2008 377,886 95,876 473,762 20.2%
2009 380,863 93,755 474,618 19.8%
2010 377,213 *64,641 441,854 *14.6%
2011 377,636 108,844 486,480 22.3%
2012 381,869 100,958 482,827 20.9%
2013 380,323 102,446 482,769 21.2%
2014 384,100 100,194 484,294 20.7%
2015 382,392 100,104 482,496 20.7%
2016 383,102 97,764 480,866 20.3%
2017 379,450 94,030 473,480 19.9%
2018 375,390 85,294 460,684 18.5%
2019 375,229 83,576 458,805 18.2%
2020 361,667 74,155 435,822 17.0%

*2010 is skewed, since Quebec didn’t fully report their totals.

This isn’t hyperbole to claim that 20% of pregnancies in recent years end with an abortion. Slaughtering large segments of future generations has been happening for decades.

Again, 4,222,858 abortions between 1970 and 2020, and that’s just Canada. Also, these are just the official figures. Factoring in the unreported, the number is likely much higher.

Don’t worry about the falling birth rates and the slaughter of Canadian children. After all, we can just import a replacement population in order to keep up.

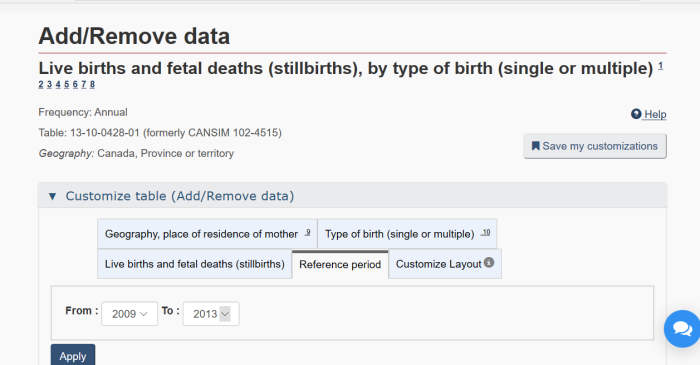
(1) https://www150.statcan.gc.ca/t1/tbl1/en/tv.action?pid=1310016901
(2) https://archive.ph/OhV01
(3) https://open.canada.ca/data/en/dataset/aca40ae3-d026-45b8-8e37-9185b4347c43
(4) https://archive.ph/Y7DYZ
(5) http://run-with-life.blogspot.com/2021/03/cihi-is-still-underreporting-abortions.html
(6) https://love4life.ca/wp-content/uploads/2013/02/Annual_20_203.pdf
(7) https://www150.statcan.gc.ca/n1/pub/82-223-x/82-223-x2008000-eng.pdf
(8) https://www5.statcan.gc.ca/cansim/a05?lang=eng&id=1069005
(9) https://www.cihi.ca/en/access-data-and-reports/data-tables?keyword=abortion&published_date=All&type_of_care=All&place_of_care=All&population_group=All&health_care_quality=All&health_conditions_outcomes=All&health_system_overview=All&sort_by=field_published_date_value&items_per_page=10
(10) https://www.arcc-cdac.ca/wp-content/uploads/2020/07/statistics-abortion-in-canada.pdf
(11) https://www150.statcan.gc.ca/t1/tbl1/en/cv.action?pid=1310042801#timeframe
(12) https://www150.statcan.gc.ca/t1/tbl1/en/tv.action?pid=1310071001
(13) https://www.parl.ca/legisinfo/en/bill/43-2/c-233
(14) http://data.un.org/Data.aspx?q=abortion+statistics&d=POP&f=tableCode%3a17
(15) https://abortion-policies.srhr.org/
(16) https://www.who.int/news-room/fact-sheets/detail/abortion

(Now Available) Borderless Canada: Replacement Migration & Fifth Columnists Operating Within

With all the content given out, occasionally, an ad needs to be run. And this is another book. The 4th one, Borderless Canada, is now available both in paperback and as an e-book. This helps support the costs of running the website, and ensures the information reaches a wider audience.

Borderless Canada: The many hidden costs of the mass migration policies, including economic, social, and cultural. This couldn’t have happened without many subversive interests pushing it. Many know that politicians act as puppets, but not how deep it goes.

Most people aren’t remotely aware of what’s happening on the subjects of borders and immigration. Nor do they grasp the full extent of subversion agents and NGOs working towards these goals. Partly, this is intentional, as politicians and media figures aren’t interested in a fully informed public. You think those subsidies are just a form of charity?

This cannot be explained as simple incompetence or cluelessness. The replacement of the West has long been a deliberate aim.

Also, this isn’t a partisan issue. The bulk of the “right wing” in Canadian politics supports this destruction, as do many of their voters. They just insist it be done legally, and with economic benefits.

Of course, earlier publications are still available.

Twenty Twenty-One: A condensed form of this research into the fake pandemic in Canada. Hard details and stats provided throughout, refuting virtually all major Government claims. Spoiler, there isn’t a “pandemic” at all.

Inside The Ontario Science Table: The sequel focuses on the “independent experts” calling for Ford to keep the Province locked down, and pushing and pandemic narrative. The ties to the University of Toronto and big pharma run very deep.

The Green Bankers Cartel: There’s a lot more than meets the eye to the climate change movement. Far from the image of being grassroots, the financial sector sees it as opportunity. Useful idiots support it anyway, without realizing that they advocate for policies that ensure their own enslavement. We are told “The debate is over” as a means of stifling legitimate concerns and inquiries.

All of these are available online either as ebooks, or paperback.

Chambers Of Commerce: Collecting Subsidies While Calling For Open Borders

According to the CEWS Registry, the Canada Emergency Wage Subsidy has been handed out to some 235 institutions that have “Chamber of Commerce” as part of their name. That should alarm people, that hundreds of organizations that claim to promote business are getting handouts from Ottawa — or rather, taxpayers.

The Chambers of Commerce are just part of a long list of institutions that are getting funded to shill the “pandemic” narrative. These include: restaurants and hotels, political parties, law firms, more law firms, churches, and trucking associations, to name a few.

While it would be unrealistic to do a profile on all 235 organizations, let’s take a look at one: The Canadian Chamber of Commerce.

Description of the organization’s activities
Founded in 1925, the Canadian Chamber of Commerce is the nation’s largest business association, representing small and large firms from every sector and region in Canada. The Canadian Chamber is a network of 420 community chambers and boards of trade across Canada, in addition to individual corporate members and over 80 trade and professional organizations. The total membership exceeds 192,000. It is dedicated to the promotion and development of a strong economy. The chamber monitors federal and international issues, solicits the views of the Canadian business community and communicates them to policymakers in Ottawa and internationally. Headquartered in Ottawa, it also has staff in Toronto, Montreal and Calgary.

This is how the group describes its activities.

Instead of calling for people to be able to run their businesses freely, and with minimal interference, the Chamber of Commerce parrots the line that vaccines and rapid tests are the quickest way back to normal. On the surface, it looks like they are playing along because of the financial incentives provided. More on that coming up.

The “wins” they brag about include getting CEWS and CERS extended. CERS is the Canada Emergency Rental Subsidy which is available for businesses. This “business” group also brags about getting the hiring subsidy created, so that taxpayers help fund new employees.

While this organization does receive private donations, it undeniably is getting Government handouts as well. In fact, this has been happening for many years.

GOVERNMENT BRANCH SOURCE YEAR AMOUNT
Bank of Canada 2019 $1,375.00
Business Development Bank of Canada (BDC) 2015 $5,000.00
Canada Foundation for Innovation 2020 $2,300.00
Canada Mortgage and Housing Corporation (CMHC) 2021 $5,000.00
Canada Post Corporation (CPC) 2014 $10,000.00
Canada Post Corporation (CPC) 2015 $6,000.00
Canada Post Corporation (CPC) 2017 $6,000.00
Canada Post Corporation (CPC) 2018 $1,900.00
Canada Post Corporation (CPC) 2020 $10,000.00
Canada Post Corporation (CPC) 2021 $30,000.00
Canada Revenue Agency (CRA) 2020 $850,623.60
Canada Revenue Agency (CRA) 2021 $118,464.75
Competition Bureau Canada (COBU) 2016 $1,800.00
Employment and Social Development Canada (ESDC) 2018 $3,400.00
Employment and Social Development Canada (ESDC) 2019 $74,496.00
Employment and Social Development Canada (ESDC) 2020 $22,451.00
Employment and Social Development Canada (ESDC) 2021 $12,180
Environment and Climate Change Canada (ECCC) 2017 $56,548.68
Environment and Climate Change Canada (ECCC) 2018 $29,600.00
Environment and Climate Change Canada (ECCC) 2019 $2,500.00
Export Development Canada (EDC) 2014 $37,500.00
Export Development Canada (EDC) 2015 $29,000.00
Export Development Canada (EDC) 2016 $42,000.00
Export Development Canada (EDC) 2017 $63,000.00
Export Development Canada (EDC) 2018 $65,000.00
Export Development Canada (EDC) 2019 $65,000.00
Export Development Canada (EDC) 2020 $51,000.00
Export Development Canada (EDC) 2021 $79,100.00
Farm Credit Canada (FCC) 2018 $2,500.00
FedDev Agency for Southern Ontario 2018 $2,300.00
FedDev Agency for Southern Ontario 2020 $2,300.00
Global Affairs Canada (GAC) 2017 $1,900.00
Global Affairs Canada (GAC) 2018 $1,900.00
Global Affairs Canada (GAC) 2019 $2,300.00
Health Canada (HC) 2021 $4,947,978.19
Industry Canada 2014 $1,500.00
Innovation, Science and Economic Development Canada 2015 $1,800.00
Innovation, Science and Economic Development Canada 2016 $2,300.00
Innovation, Science and Economic Development Canada 2018 $2,300.00
Innovation, Science and Economic Development Canada 2019 $2,300.00
Innovation, Science and Economic Development Canada 2020 $530,300.00
Innovation, Science and Economic Development Canada 2021 $2,300.00
Montreal Port Authority 2020 $5,000.00
Montreal Port Authority 2021 $5,000.00
Natural Resources Canada (NRCan) 2015 $132,300.00
Natural Resources Canada (NRCan) 2017 $22,122.12
Office of the Privacy Commissioner of Canada (OPC) 2014 $1,500.00
Office of the Privacy Commissioner of Canada (OPC) 2015 $1,800.00
Office of the Privacy Commissioner of Canada (OPC) 2016 $1,800.00
Office of the Privacy Commissioner of Canada (OPC) 2017 $1,900.00
Office of the Privacy Commissioner of Canada (OPC) 2019 $2,000.00
Office of the Procurement Ombudsman (OPO) 2020 $2,300.00
Office of the Taxpayers’ Ombudsman 2018 $2,300.00
Ontario Federation of Agriculture 2020 $5,000.00
Port Alberni Port Authority 2016 $10,000.00
Prince Rupert Port Authority 2016 $4,500.00
Public Works and Government Services Canada 2014 $1,500.00
Royal Canadian Mint 2014 $2,500.00
Vancouver Fraser Port Authority (Port Metro Vancouver) 2014 $32,500.00
Vancouver Fraser Port Authority (Port Metro Vancouver) 2015 $10,000.00
Vancouver Fraser Port Authority (Port Metro Vancouver) 2016 $43,000.00
Vancouver Fraser Port Authority (Port Metro Vancouver) 2017 $65,000.00
Vancouver Fraser Port Authority (Port Metro Vancouver) 2018 $50,000.00
Vancouver Fraser Port Authority (Port Metro Vancouver) 2019 $40,000.00
Vancouver Fraser Port Authority (Port Metro Vancouver) 2020 $40,000.00
Vancouver Fraser Port Authority (Port Metro Vancouver) 2021 $57,500.00
VIA Rail Canada 2016 $7,500.00
VIA Rail Canada 2017 $18,500.00
VIA Rail Canada 2019 $10,000.00
VIA Rail Canada 2020 $10,000.00
VIA Rail Canada 2021 $15,000.00

You’d be forgiven for thinking that these were really Communists. Now, what is the Chamber of Commerce getting for itself? The listings should scare you. Keep in mind, that other Chambers of Commerce are likely also receiving money at the local level.

The Canadian Chamber of Commerce has been getting handouts going back many years. The CEWS is really just the least of it. It would also be interesting to know what the conditions were for that nearly $5 million they received from Health Canada.

The Chamber doesn’t appear to call for the end to martial law restrictions. Instead, they lobby for more handouts in order to cope with lockdowns. For a business orientated group, they seem completely okay with Government interference and restrictions.

There also appears to be no issue with policies like vaccine passports. After all, if Canadians don’t want to play along, they can just be replaced by TFWs who took the shots as a condition of employment.

This group also calls for drastically increased immigration, and more ways to remain in Canada. They also support free trade which will see industries outsourced based on cost. Think about how this plays out in the long term.

[1] Flood Canada with more people, driving up demand for work
[2] Support trade deals which reduce the supply of available work

Never mind the social impacts of importing large numbers from very different backgrounds, or the culture clash that will result. It appears these business groups don’t care about such things.

If you think it’s bad now, the agenda from a few years back is even worse. Or perhaps it’s just more open about what they really wanted then.

BORDER CROSSINGS – Beyond the Borders Initiative, with respect to implementation of the action plan items.
BORDER CROSSINGS – with respect to the development of a new International Crossing between Windsor and Detroit.
FREE TRADE AGREEMENTS – Promote balanced free trade agreements for Canada with Europe, India Japan and Korea. Promote Canada’s participation in the Trans-Pacific partnership and in the Trade in Services Agreement
IMMIGRATION – Expedited application process with regard to giving priority to applicants who possess skills in short supply in Canada and processing their applications within 6-12 months.
IMMIGRATION – Foreign Credentials Recognition Program with regard to working with the provinces/territories and business community to develop national accreditation standards to evaluate foreign credentials, professional and trade qualifications, and certification in regulated and non-regulated occupations that reflect employers’ needs
IMMIGRATION: Changes intended to attract and retain international students with respect to work permits, applications for permanent residency, and processing times for applications.
IMMIGRATION: Changes to increase the number of economic immigrants to this country to double the current rate. Renegotiation and signing of new memoranda of understanding with each of the provinces and territories to increase provincial caps for Provincial Nominee Programs. Adequate staffing of local Citizenship and Immigration Canada offices to meet demand and alleviate the labour market shortages.
IMMIGRATION: Regional strategy for settlement needs and at levels of service to ensure access to skilled workers in all regions of the country.
International Trade: Expanding trade and investment links with developing countries.
Labour: Ensuring that any changes to the Canada Labour Code are implemented only if they address a real problem or result in improvement for these employers, their employee and/or the Canadians they serve.
Labour: Asking the federal government, specifically the Department of Foreign Affairs, Trade and Development, to work with the Canadian private sector to identify ways to increase long-term formal employment opportunities for the poor in developing countries, and facilitate the availability of financial institutional products and services, including microfinance, to stimulate job creation for the poor

The above section includes items from 2014 (#36 on their profile with the Lobbying Registry). The Canadian Chamber of Commerce (and presumably all chapters) support virtually open borders as it ensures ready access to an endless supply of cheaper labour.

Put bluntly, Canadian taxpayers are helping to finance groups calling for outsourcing of industries, and the importing of a new work force for what’s left. It not only causes havoc with jobs, but drives down wages for the ones that remain.

Now, about those 235 groups receiving the CEWS:

  • 1000 ISLANDS GANANOQUE CHAMBER OF COMMERCE
  • ABBOTSFORD CHAMBER OF COMMERCE
  • Aboriginal Chamber Of Commerce – Grand Rapids
  • AIRDRIE CHAMBER OF COMMERCE
  • ALBERNI VALLEY CHAMBER OF COMMERCE
  • ALBERTA CHAMBERS OF COMMERCE
  • ANNAPOLIS VALLEY CHAMBER OF COMMERCE
  • AURORA CHAMBER OF COMMERCE
  • BAFFIN REGIONAL CHAMBER OF COMMERCE
  • BANCROFT & DISTRICT CHAMBER OF COMMERCE
  • BATHURST CHAMBER OF COMMERCE
  • BATTLEFORDS CHAMBER OF COMMERCE
  • BEAUMONT CHAMBER OF COMMERCE ASSOCIATION
  • BONNYVILLE & DISTRICT CHAMBER OF COMMERCE SOCIETY
  • BOW VALLEY CHAMBER OF COMMERCE ASSOCIATION
  • BRACEBRIDGE CHAMBER OF COMMERCE
  • BRANDON CHAMBER OF COMMERCE
  • BRAZIL-CANADA CHAMBER OF COMMERCE
  • BRIGHTON AND DISTRICT CHAMBER OF COMMERCE
  • BROCKVILLE CHAMBER OF COMMERCE
  • BURLINGTON CHAMBER OF COMMERCE
  • BURNS LAKE & DISTRICT CHAMBER OF COMMERCE
  • CAMBRIDGE CHAMBER OF COMMERCE
  • CAMERA DI COMMERCIO ITALIANA DELL’ ONTARIO/ITALIAN CHAMBER OF COMMERCE OF ONTARIO
  • CAMPBELL RIVER AND DISTRICT CHAMBER OF COMMERCE
  • CAMROSE CHAMBER OF COMMERCE
  • CANADIAN GERMAN CHAMBER OF INDUSTRY AND COMMERCE INC
  • Canadian Women’s Chamber of Commerce
  • CASTLEGAR & DISTRICT CHAMBER OF COMMERCE
  • CENTRE WELLINGTON CHAMBER OF COMMERCE
  • CHAMBER OF COMMERCE BRANTFORD-BRANT
  • CHAMBER OF COMMERCE SERVING COQUITLAM, PORT COQUITLAM PORT MOODY
  • Chamber of Marine Commerce CHAMBRE DE COMMERCE MARITIME
  • Chambre de commerce Canada-Floride/ Chamber of commerce Canada-florida
  • Chambre de commerce de l’Est de MontrĂ©al Eastern Montreal Chamber of Commerce
  • CHAMBRE DE COMMERCE ET D’INDUSTRIE DE BÉCANCOUR NICOLET-YAMASKA / BECANCOUR NICOLET-YAMASKA CHAMBER OF COMMERCE
  • CHARLOTTETOWN CHAMBER OF COMMERCE
  • CHATHAM-KENT CHAMBER OF COMMERCE
  • CHETWYND CHAMBER OF COMMERCE
  • CHILLIWACK CHAMBER OF COMMERCE
  • CLOVERDALE DISTRICT CHAMBER OF COMMERCE
  • Coboconk, Norland & Area Chamber of Commerce
  • COLD LAKE REGIONAL CHAMBER OF COMMERCE ASSOCIATION
  • COLUMBIA VALLEY CHAMBER OF COMMERCE
  • CORNWALL CHAMBER OF COMMERCE
  • COWICHAN LAKE DISTRICT CHAMBER OF COMMERCE
  • CRANBROOK CHAMBER OF COMMERCE
  • DAWSON CITY CHAMBER OF COMMERCE ASSOCIATION
  • DAWSON CREEK & DISTRICT CHAMBER OF COMMERCE
  • DELTA CHAMBER OF COMMERCE
  • DRUMHELLER AND DISTRICT CHAMBER OF COMMERCE
  • DRYDEN DISTRICT CHAMBER OF COMMERCE
  • DUNCAN-COWICHAN CHAMBER OF COMMERCE
  • EAST GWILLIMBURY CHAMBER OF COMMERCE
  • EAST HANTS AND DISTRICTS CHAMBER OF COMMERCE
  • Eastern Prince Edward Island Chamber of Commerce Inc.
  • EDMONTON CHAMBER OF COMMERCE
  • EDMUNDSTON CHAMBER OF COMMERCE/LA CHAMBRE DE COMMERCE DE LA REGION D’EDMUNDSTON INC
  • ESTEVAN CHAMBER OF COMMERCE
  • FENELON FALLS CHAMBER OF COMMERCE
  • FERNIE CHAMBER OF COMMERCE
  • FORT FRANCES CHAMBER OF COMMERCE
  • FORT MACLEOD AND DISTRICT CHAMBER OF COMMERCE
  • FORT MCMURRAY CHAMBER OF COMMERCE
  • FORT NELSON CHAMBER OF COMMERCE
  • FORT SASKATCHEWAN CHAMBER OF COMMERCE
  • FORT ST JOHN AND DISTRICT CHAMBER OF COMMERCE
  • FREDERICTON CHAMBER OF COMMERCE
  • GANDER & AREA CHAMBER OF COMMERCE INC
  • GEORGINA CHAMBER OF COMMERCE
  • GIBSONS AND DISTRICT CHAMBER OF COMMERCE
  • GRANDE PRAIRIE CHAMBER OF COMMERCE
  • GRAVENHURST CHAMBER OF COMMERCE
  • GREATER BARRIE CHAMBER OF COMMERCE
  • GREATER KINGSTON CHAMBER OF COMMERCE
  • GREATER LANGLEY CHAMBER OF COMMERCE
  • GREATER NANAIMO CHAMBER OF COMMERCE
  • GREATER NIAGARA CHAMBER OF COMMERCE
  • GREATER OSHAWA CHAMBER OF COMMERCE
  • GREATER PETERBOROUGH CHAMBER OF COMMERCE
  • Greater Saskatoon Chamber of Commerce
  • GREATER SUDBURY CHAMBER OF COMMERCE
  • GREATER VERNON CHAMBER OF COMMERCE
  • GREATER VICTORIA CHAMBER OF COMMERCE
  • GRIMSBY & DISTRICT CHAMBER OF COMMERCE
  • GUANGDONG CHAMBER OF COMMERCE (CANADA)
  • GUELPH CHAMBER OF COMMERCE
  • HALIBURTON HIGHLANDS CHAMBER OF COMMERCE
  • HALIFAX CHAMBER OF COMMERCE
  • HALTON HILLS CHAMBER OF COMMERCE
  • HUMBOLDT AND DISTRICT CHAMBER OF COMMERCE CORP.
  • HUNTSVILLE CHAMBER OF COMMERCE
  • INDO-CANADA CHAMBER OF COMMERCE
  • INNISFAIL AND DISTRICT CHAMBER OF COMMERCE SOCIETY
  • ITALIAN CHAMBER OF COMMERCE IN CANADA – WEST/CAMERA DI COMMERCIO ITALIANA IN CANADA – OVEST
  • JASPER PARK CHAMBER OF COMMERCE
  • KAMLOOPS CHAMBER OF COMMERCE
  • KAWARTHA LAKES CHAMBER OF COMMERCE-EASTERN REGION
  • KELOWNA CHAMBER OF COMMERCE
  • KENORA AND DISTRICT CHAMBER OF COMMERCE
  • KENSINGTON AND AREA CHAMBER OF COMMERCE
  • KIMBERLEY BAVARIAN SOCIETY
  • KINDERSLEY CHAMBER OF COMMERCE
  • KITIMAT CHAMBER OF COMMERCE
  • LA CHAMBRE DE COMMERCE DE GASPE – /GASPÉ CHAMBER OF COMMERCE
  • LA CHAMBRE DE COMMERCE DE MANIWAKI-THE MANIWAKI CHAMBER OF COMMERCE
  • LA CHAMBRE DE COMMERCE ITALIENNE AU CANADA. ITALIAN CHAMBER OF COMMERCE IN CANADA CAMERA DI COMMERCIO ITALIANA IN CANADA
  • LA CRETE AREA CHAMBER OF COMMERCE
  • LAB WEST CHAMBER OF COMMERCE
  • LABRADOR NORTH CHAMBER OF COMMERCE INC.
  • LAC LA BICHE & DISTRICT CHAMBER OF COMMERCE
  • Lacombe and District Chamber of Commerce
  • LADYSMITH CHAMBER OF COMMERCE
  • LAKE COUNTRY CHAMBER OF COMMERCE
  • LEAMINGTON DISTRICT CHAMBER OF COMMERCE
  • LEDUC REGIONAL CHAMBER OF COMMERCE
  • LETHBRIDGE CHAMBER OF COMMERCE
  • LINCOLN CHAMBER OF COMMERCE
  • LINDSAY CHAMBER OF COMMERCE
  • LLOYDMINSTER CHAMBER OF COMMERCE
  • LONDON CHAMBER OF COMMERCE
  • MEDICINE HAT AND DISTRICT CHAMBER OF COMMERCE
  • MILTON CHAMBER OF COMMERCE
  • MOOSE JAW CHAMBER OF COMMERCE
  • MORDEN AND DISTRICT CHAMBER OF COMMERCE
  • MOUNT PEARL PARADISE CHAMBER OF COMMERCE
  • MUSKOKA LAKES CHAMBER OF COMMERCE
  • NELSON AND DISTRICT CHAMBER OF COMMERCE
  • NEW WESTMINSTER CHAMBER OF COMMERCE
  • NEWMARKET CHAMBER OF COMMERCE INC.
  • NIAGARA-ON-THE-LAKE CHAMBER OF COMMERCE
  • NORTH BAY AND DISTRICT CHAMBER OF COMMERCE
  • Northumberland Central Chamber of Commerce
  • NWT CHAMBER OF COMMERCE
  • OAKVILLE CHAMBER OF COMMERCE
  • ORILLIA AND DISTRICT CHAMBER OF COMMERCE
  • ORO-MEDONTE CHAMBER OF COMMERCE
  • OWEN SOUND & DISTRICT CHAMBER OF COMMERCE
  • PARKSVILLE & DISTRICT CHAMBER OF COMMERCE
  • PEACE RIVER BOARD OF TRADE AND CHAMBER OF COMMERCE
  • PEACHLAND CHAMBER OF COMMERCE
  • PEMBERTON AND DISTRICT CHAMBER OF COMMERCE
  • PENTICTON AND WINE COUNTRY CHAMBER OF COMMERCE
  • PLACENTIA AREA CHAMBER OF COMMERCE
  • PONOKA & DISTRICT CHAMBER OF COMMERCE SOCIETY
  • PORT HARDY & DISTRICT CHAMBER OF COMMERCE
  • PORT HOPE AND DISTRICT CHAMBER OF COMMERCE
  • PORTAGE LA PRAIRIE AND DISTRICT CHAMBER OF COMMERCE
  • POWELL RIVER CHAMBER OF COMMERCE
  • PRAIRIE SKY CHAMBER OF COMMERCE INC.
  • PRINCE GEORGE CHAMBER OF COMMERCE
  • QUESNEL AND DISTRICT CHAMBER OF COMMERCE
  • QUINTE WEST CHAMBER OF COMMERCE
  • RADIUM HOT SPRINGS CHAMBER OF COMMERCE
  • RED DEER CHAMBER OF COMMERCE
  • REGINA & DISTRICT CHAMBER OF COMMERCE
  • RENFREW CHAMBER OF COMMERCE
  • REVELSTOKE CHAMBER OF COMMERCE
  • RICHMOND CHAMBER OF COMMERCE
  • RUSSELL AND DISTRICT CHAMBER OF COMMERCE
  • SALT SPRING ISLAND CHAMBER OF COMMERCE
  • SARNIA LAMBTON CHAMBER OF COMMERCE
  • SASKATCHEWAN CHAMBER OF COMMERCE
  • SAUGEEN SHORES CHAMBER OF COMMERCE
  • SAULT STE MARIE AND DISTRICT OF CHAMBER OF COMMERCE
  • SELKIRK & DISTRICT CHAMBER OF COMMERCE INC
  • SHERWOOD PARK & DISTRICT CHAMBER OF COMMERCE
  • SICAMOUS AND DISTRICT CHAMBER OF COMMERCE
  • SIMCOE AND DISTRICT CHAMBER OF COMMERCE
  • SMITHERS DISTRICT CHAMBER OF COMMERCE
  • SMITHS FALLS CHAMBER OF COMMERCE
  • SOCIETY OF THE MORINVILLE AND DISTRICT CHAMBER OF COMMERCE
  • SOUTH SURREY AND WHITE ROCK CHAMBER OF COMMERCE
  • SOUTHERN GEORGIAN BAY CHAMBER OF COMMERCE
  • Springfield Chamber of Commerce Inc.
  • SQUAMISH CHAMBER OF COMMERCE.
  • ST. ALBERT AND DISTRICT CHAMBER OF COMMERCE SOCIETY
  • ST PAUL & DISTRICT CHAMBER OF COMMERCE ASSOCIATION
  • ST THOMAS CHAMBER OF COMMERCE
  • STONY PLAIN & DISTRICT CHAMBER OF COMMERCE
  • STRATHROY AND DISTRICT CHAMBER OF COMMERCE
  • SUMMERLAND CHAMBER OF COMMERCE
  • SUSSEX AND DISTRICT CHAMBER OF COMMERCE INC.
  • SWIFT CURRENT CHAMBER OF COMMERCE
  • SYLVAN LAKE CHAMBER OF COMMERCE
  • THE ARMSTRONG-SPALLUMCHEEN CHAMBER OF COMMERCE
  • THE BRITISH COLUMBIA CHAMBER OF COMMERCE
  • THE CALGARY CHAMBER OF COMMERCE
  • THE CANADIAN CHAMBER OF COMMERCE
  • THE CHAMBER OF COMMERCE NIAGARA FALLS, CANADA
  • THE EDSON AND DISTRICT CHAMBER OF COMMERCE
  • The Greater Kitchener Waterloo Chamber of Commerce
  • THE GREATER MONCTON CHAMBER OF COMMERCE
  • THE GREATER SUMMERSIDE CHAMBER OF COMMERCE
  • THE HAMILTON CHAMBER OF COMMERCE
  • THE MACKENZIE CHAMBER OF COMMERCE
  • THE MANITOBA CHAMBERS OF COMMERCE
  • THE MOUNT FOREST DISTRICT CHAMBER OF COMMERCE
  • THE PARRY SOUND AREA CHAMBER OF COMMERCE
  • THE PAS AND DISTRICT CHAMBER OF COMMERCE
  • THE PERTH CHAMBER OF COMMERCE
  • THE PRINCE EDWARD COUNTY CHAMBER OF COMMERCE
  • THE SAANICH PENINSULA CHAMBER OF COMMERCE
  • THE TABER CHAMBER OF COMMERCE
  • The Winkler and District Chamber of Commerce
  • THE WINNIPEG CHAMBER OF COMMERCE
  • THUNDER BAY CHAMBER OF COMMERCE
  • TILLSONBURG DISTRICT CHAMBER OF COMMERCE
  • TIMMINS CHAMBER OF COMMERCE
  • TOBERMORY & DISTRICT CHAMBER OF COMMERCE
  • TOFINO-LONG BEACH CHAMBER OF COMMERCE
  • Trail Chamber of Commerce
  • TRENT HILLS AND DISTRICT CHAMBER OF COMMERCE
  • TRURO AND DISTRICT CHAMBER OF COMMERCE
  • UCLUELET CHAMBER OF COMMERCE
  • VAUGHAN CHAMBER OF COMMERCE
  • VEGREVILLE & DISTRICT CHAMBER OF COMMERCE
  • VERMILION CHAMBER OF COMMERCE
  • WASKESIU CHAMBER OF COMMERCE
  • WELLAND/PELHAM CHAMBER OF COMMERCE
  • WEST PRINCE CHAMBER OF COMMERCE
  • WEST SHORE CHAMBER OF COMMERCE
  • WEST VANCOUVER CHAMBER OF COMMERCE
  • WEYBURN CHAMBER OF COMMERCE
  • WHITBY CHAMBER OF COMMERCE
  • WHITCHURCH STOUFFVILLE CHAMBER OF COMMERCE
  • WHITECOURT AND DISTRICT CHAMBER OF COMMERCE
  • WHITEHORSE CHAMBER OF COMMERCE
  • WIARTON AND DISTRICT CHAMBER OF COMMERCE
  • WILLIAMS LAKE & DISTRICT CHAMBER OF COMMERCE
  • Windsor-Essex Regional Chamber of Commerce
  • WOODSTOCK CHAMBER OF COMMERCE
  • YARMOUTH AND AREA CHAMBER OF COMMERCE
  • YELLOWKNIFE CHAMBER OF COMMERCE
  • YORKTON CHAMBER OF COMMERCE

Do you get it now? Your tax dollars are being used to support these “Chambers of Commerce”. These groups lobby Federal and Provincial Governments to spend even more money propping up businesses which impose mask and vaccine rules. They also support the open border agenda to mass import people who will work for less, and who are more receptive to taking experimental shots.

In many ways, this comes across as a protection racket. These groups push for certain “safety” grants and measures for their members, but always ones that profit them as well.

(1) https://chamber.ca/
(2) https://chamber.ca/campaign/business-led-recovery/
(3) https://chamber.ca/advocacy/wins-for-canadian-business/
(4) https://apps.cra-arc.gc.ca/ebci/hacc/cews/srch/pub/bscSrch
(5) https://apps.cra-arc.gc.ca/ebci/habs/cews/srch/pub/dsplyBscSrch?request_locale=en
(6) https://lobbycanada.gc.ca/app/secure/ocl/lrs/do/vwRg?regId=812012&cno=15787#regStart

(A) https://canucklaw.ca/media-subsidies-and-govt-financing/
(B) https://canucklaw.ca/media-controlled-opposition/
(C) https://canucklaw.ca/groups-calling-for-vaccine-passports-heavily-subsidized-by-government/
(D) https://canucklaw.ca/trudeau-using-taxpayer-money-to-subsidize-opposition-parties-liberals-too/
(E) https://canucklaw.ca/law-firms-bar-associations-receiving-canada-emergency-wage-subsidy-cews/
(F) https://canucklaw.ca/conflicting-out-its-not-just-cews-that-the-lawyers-are-receiving/
(G) https://canucklaw.ca/following-the-money-why-are-churches-really-pushing-the-vaxx-agenda
(H) https://canucklaw.ca/canadian-trucking-alliance-raising-lots-of-questions-lately/