
(It’s a constantly repeated lie that temporary workers are only temporary. They will return home once their visas expire, and not become permanent residents.)
(It’s also a lie that students will return home. In most cases, they are eligible for the PGWP, and many transition directly to permanent residents.)

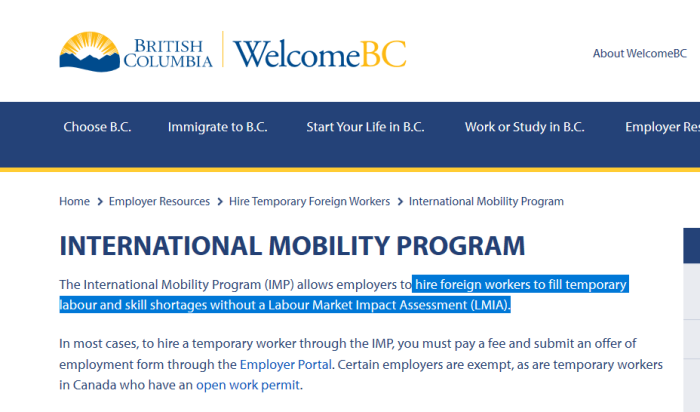
(International Mobility Program, essentially an extension of TFWP, but no labour shortages actually are required. Open work permits)
(If immigration grows our economy, then why is so much money being sent out of the country? Shouldn’t that money be spent here?)
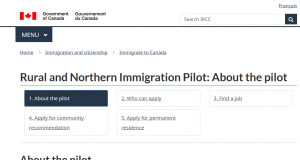
(Making Northern towns unrecognizable is the goal.)
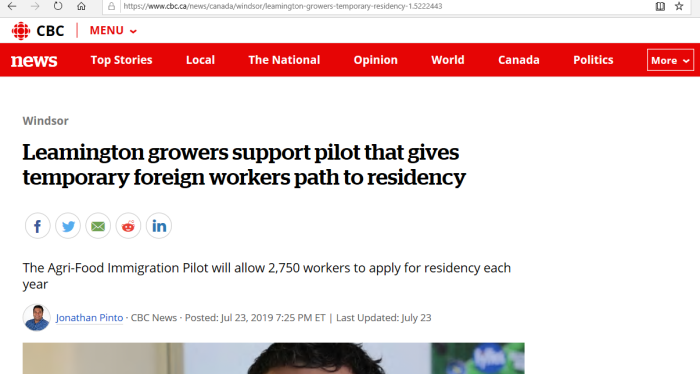
(Agriculture workers have pathway to PR)
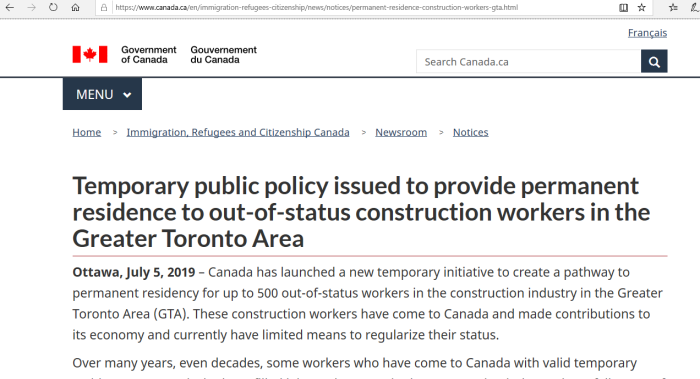
(Program launched in July: PR-Path for illegals)
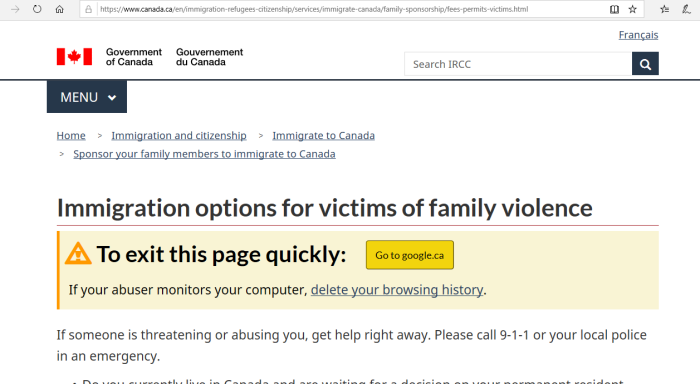
(Program launched in July: Domestic violence ==> PR-Path)
(CANZUK, possibly the biggest open borders and globalist free trade deal in history, is official CPC policy.)

1. Mass LEGAL Immigration In Canada
Despite what many think, LEGAL immigration into Canada is actually a much larger threat than illegal aliens, given the true scale of the replacement that is happening. What was founded as a European (British) colony is becoming unrecognizable due to forced demographic changes. There are also social, economic, environmental and voting changes to consider. See this Canadian series, and the UN programs for more detail. Politicians, the media, and so-called “experts” have no interest in coming clean on this.
CLICK HERE, for UN Genocide Prevention/Punishment Convention.
CLICK HERE, for Barcelona Declaration & Kalergi Plan.
CLICK HERE, for UN Kalergi Plan (population replacement).
CLICK HERE, for UN replacement efforts since 1974.
CLICK HERE, for tracing steps of UN replacement agenda.
Note: If there are errors in calculating the totals, please speak up. Information is of no use to the public if it isn’t accurate.
2. Context For This Article
As has been reported many times on this site, immigration is nowhere near what is reported in the media. Specifically, when students and so-called “temporary” workers are factored in, it is double or triple what we are lead to believe.
Why does this matter? For a number of reasons. First, it is misleading to omit that these groups are eligible for permanent resident status. That means, most can and will remain in Canada much, MUCH longer than originally stated. It artificially lowballs the immigration rate. Yes, not everyone stays, but many will, especially if they have built roots here.
Second, most people head to the larger cities, which strain to accommodate more and more people. This results in overburdened social services, congestion, and overcrowding. And contrary to conservatives and libertarians, there is a huge financial cost to these influxes.
Third, large scale mass migration has the effect of drastically changing the culture, the societal makeup, demographics (yes, race) and the voting patterns in elections. For example, importing large numbers of people who want hate speech laws, strong gun control, and socialist rule means that voting starts trending that way. Problem is, that no one ever voted to have their societies so changed.
Fourth, it brings incompatible cultures together, again, with no mandate from the host population. Islamic Hijrah (conquest by immigration) is the most obvious, but not the only one. There’s also Chinese expansion, Sikh nationalists, and replaying of ethnic conflicts, just to name a few.
In short, mass migration completely remakes a nation, and a lot of it in negative ways. Problem is (again), no one voted for it. And repeatedly lying to minimize the scale of it only serves to make things worse.
3. Annual Reports To Parliament
2004.annual.immigration.report.to.parliament
2005.annual.immigration.report.to.parliament
2006.annual.immigration.report.to.parliament
2007.annual.immigration.report.to.parliament
2008.annual.immigration.report.to.parliament
2009.annual.immigration.report.to.parliament
2010.annual.immigration.report.to.parliament
2011.annual.immigration.report.to.parliament
2012.annual.immigration.report.to.parliament
2013.annual.immigration.report.to.parliament
2014.annual.immigration.report.to.parliament
2015.annual.immigration.report.to.parliament
2016.annual.immigration.report.to.parliament
2017.annual.immigration.report.to.parliament
2018.annual.immigration.report.to.parliament
2019.annual.immigration.report.to.parliament.
CLICK HERE, for archived listings.
Note: From the 2004 to 2018 reports (which cover 2003-2017) we can take the “temporary” migration data as well. For this, “temporary” refers to:
(a) Temporary Foreign Worker Program;
(b) International Mobility Program;
(c) Student Visas
Here’s a snapshot of these “temporary” programs from the years 2015 to 2017. Source is the 2018 Annual Report to Parliament on Immigration.
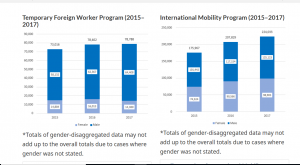
| Year | TFW | Int Mobility | Student |
|---|---|---|---|
| 2015 | 73,016 | 175,967 | 218,147 |
| 2016 | 78,402 | 207,829 | 265,111 |
| 2017 | 78,788 | 224,033 | 317,328 |
Above are the “temporary” categories listed in the Annual Immigration Reports to Parliament. Now, let’s take a look at all of it in context. Data is compiled from the 2004 to 2018 Annual Reports (which covers the years of 2003 to 2017)
| Report Year | Stated Imm | Temporary | Actual Imm |
|---|---|---|---|
| 2004 | 221,352 | 143,444 | 364,796 |
| 2005 | 235,824 | 147,204 | 383,028 |
| 2006 | 262,236 | 156,622 | 418,858 |
| 2007 | 251,649 | 174,361 | 426,010 |
| 2008 | 236,758 | 229,834 | 466,592 |
| 2009 | 247,243 | 272,028 | 519,271 |
| 2010 | 252,179 | 263,618 | 515,797 |
| 2011 | 280,681 | 278,433 | 559,114 |
| 2012 | 248,748 | 289,225 | 537,973 |
| 2013 | 257,887 | 318,383 | 576,270 |
| 2014 | 258,953 | 333,175 | 592,128 |
| 2015 | 260,404 | 420,708 | 681,112 |
| 2016 | 271,845 | 468,126 | 739,971 |
| 2017 | 296,346 | 551,342 | 847,688 |
| 2018 | 331,226 | 620,149 | 951,375 |
The public is (wrongly) told that the annual averages were about 250K during the Harper years (2006 to 2015) and creeping up to 300 under Trudeau, and expected to hit about 350K in a few years. Big problem is that these claims deliberately leave out the pathway-to-PR students and “temporary” workers.
While these programs are touted as “temporary” this is extremely misleading, as an awful lot of people from all streams will remain in Canada. Either they will transition to permanent residents, or remain in some other capacity.
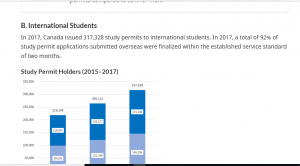
4. Surge In Student Visas
(UBC Promoting post-graduate options to students)

(University of Calgary and options for foreign students.

(University of Regina promoting permanent residence)

CLICK HERE, for Provincial Nominee Seminar at UBC.
CLICK HERE, for permanent resident information from UCalgary.
CLICK HERE, for URegina on the Sask Immigrant Nominee Program.
The above are just the first 3 that I checked out. In fact, in seems that ALL colleges and universities are offering guidance for their international students on how to remain in Canada after they graduate.
But why would they do that? The powers that be repeatedly assure us that these students are in the country temporarily, and that they will return home afterwards. It’s almost as if these student visas were a form of backdoor immigration.
| Report Year | Numbers |
|---|---|
| 2004 | 61,293 |
| 2005 | 56,536 |
| 2006 | 57,476 |
| 2007 | 61,703 |
| 2008 | 64,636 |
| 2009 | 79,509 |
| 2010 | 85,140 |
| 2011 | 96,157 |
| 2012 | 98,383 |
| 2013 | 104,810 |
| 2014 | 111,865 |
| 2015 | 127,698 |
| 2016 | 219,143 |
| 2017 | 265,111 |
| 2018 | 317,328 |
In 2003, Canada issued 60,000 student visas (rounded down) and in 2017 issued 315,000 student visas (again, rounded down). This is more than 5 times the amount, in just a 15 year period.
Sources are the 2004 to 2018 Annual Reports to Parliament on Immigration. They are listed in Section #3. Now, not everyone will stay in Canada after they are done school. But many will, and our Government makes that very easy.
5. Surge In “Temporary” Workers
Note: in 2014 there was a public scandal regarding the Temporary Foreign Worker Program. Word got out as to just how wide spread the program was, and just how many people were being “imported” into jobs that Canadians could do, but who had to be paid more.
The “solution”, if you can call it that, was to break up the TFWP into 2 categories: one where a Labour Market Impact Assessment was needed (LIMA), and one that was not (an open work permit).
In this case, the TFWP required the LIMA, whereas the previously existing International Mobility Program was scaled up (no LIMA required). To summarize, rather than fix the underlying problem, the Government decided to split up the program and call it fixed.
Temporary Foreign Worker Program
| Report Year | Numbers |
|---|---|
| 2004 | 82,151 |
| 2005 | 90,668 |
| 2006 | 99,146 |
| 2007 | 112,658 |
| 2008 | 165,198 |
| 2009 | 192,519 |
| 2010 | 178,478 |
| 2011 | 182,276 |
| 2012 | 190,842 |
| 2013 | 213,573 |
| 2014 | 221,310 |
| 2015 | 95,086 |
| 2016 | 73,016 |
| 2017 | 78,402 |
| 2018 | 78,788 |
International Mobility Program
| Report Year | Numbers |
|---|---|
| 2004 | included |
| 2005 | included |
| 2006 | included |
| 2007 | included |
| 2008 | included |
| 2009 | included |
| 2010 | included |
| 2011 | included |
| 2012 | included |
| 2013 | included |
| 2014 | included |
| 2015 | 197,924 |
| 2016 | 175,967 |
| 2017 | 207,829 |
| 2018 | 224,033 |
To offer greater clarity and transparency, the current TFWP is being reorganized and new International Mobility Programs (IMPs) are being created. The TFWP will now refer to those streams under which foreign workers enter Canada at the request of employers following approval through a new Labour Market Impact Assessment (LMIA). The new IMPs will incorporate those streams in which foreign nationals are not subject to an LMIA, and whose primary objective is to advance Canada’s broad economic and cultural national interest, rather than filling particular jobs. These reorganized programs will improve accountability, with Employment and Social Development Canada (ESDC) being the lead department for the TFWP, and Citizenship and Immigration Canada (CIC) the lead department for the IMPs. In addition, ESDC will publicly post data on the number of positions for temporary foreign workers approved through the TFWP on a quarterly basis, and will post the names of corporations that receive permission to hire temporary foreign workers through LMIAs.
Source is right here.
For some context, consider that in 2003, about 80,000 temporary workers were admitted into Canada. That contrasts with over 300,000 in 2017 (when TFWP and IMP both factored in). That is nearly 4 times the amount in just 15 years.
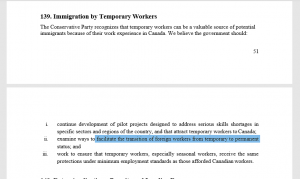
CPC Supports Temp-To-PR Pipeline
The Conservative Party of Canada supports both: creating new immigration pilot programs, and transitioning temporary workers into permanent residents. That is listed in Article 139 of their Policy Declaration (found under Governing Documents)
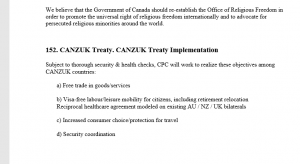
Also worth noting that CANZUK is official CPC policy as well, Article 152 of their Policy Declaration. CANZUK, when fully implemented would allow free trade and free travel between Canada, Australia, New Zealand and the United Kingdom. Effectively, it would erase the borders between those nations. Aside from the obvious problems, other nations like India, Pakistan, and the rest of the Commonwealth could potentially join. Would all of those “temporary” people be PR eligible as well?
To be fair, the People’s Party of Canada, which claims to “open the Overton window” on immigration, never addresses any of the following:
(a) True scale of mass migration;
(b) Temps/Students transitioning to PR;
(c) Importing the 3rd World;
(d) Rapid demographic change;
(e) Changes in voting trends, less conservatism;
(f) CANZUK being implemented
It would be nice if these Annual Reports to Parliament were more detailed in which programs/streams people were transitioning into permanent residents. It would also help for more information on how many people remain in the country but don’t become citizens. Alas, such useful data is lacking.
To address the elephant in the room: not all of the temporary workers do stay in Canada. Similarly, not all students stay in Canada after they graduate. But an awful lot do. Unfortunately, the Canadian Government doesn’t easily provide that information, so it has to be pieced together.
6. Remittances Sent Back Home
The Bank estimates that officially recorded annual remittance flows to low- and middle-income countries reached $529 billion in 2018, an increase of 9.6 percent over the previous record high of $483 billion in 2017. Global remittances, which include flows to high-income countries, reached $689 billion in 2018, up from $633 billion in 2017.
Among countries, the top remittance recipients were India with $79 billion, followed by China ($67 billion), Mexico ($36 billion), the Philippines ($34 billion), and Egypt ($29 billion).
The Brief also reports progress toward the SDG target of reducing the recruitment costs paid by migrant workers, which tend to be high, especially for lower-skilled migrants.
The World Bank estimates that $689 billion was sent in remittances globally in the year 2018. Globalist politicians repeatedly say that immigration brings wealth to the country, but it seems to be a source of draining it.
Global Remittances In Recent Years
| Year | Total ($B) | To 1st World | To 3rd World | Diff. |
|---|---|---|---|---|
| 2013 | $581B | $177B | $404B | $227B |
| 2014 | $592B | $162B | $430B | $268B |
| 2015 | $582B | $142B | $440B | $298B |
| 2016 | $573B | $144B | $429B | $285B |
| 2017 | $613B | $147B | $466B | $319B |
| 2018 | $689B | $161B | $528B | $367B |
CLICK HERE, for World Bank, remittances in 2013.
CLICK HERE, for World Bank, remittances in 2015.
CLICK HERE, for World Bank, remittances in 2016.
CLICK HERE, for World Bank, remittances in 2017.
CLICK HERE, for World Bank, remittances in 2018.
Biggest Recipients Of US $ (2018)
| Rank | Nation | Est. ($ Billions) |
|---|---|---|
| 1 | Mexico | 30.019 |
| 2 | China | 16.141 |
| 3 | India | 11.714 |
| 4 | Philippines | 11.099 |
| 5 | Vietnam | 7.735 |
| 6 | Guatemala | 7.725 |
| 7 | Nigeria | 6.191 |
| 8 | El Salvador | 4.611 |
| 9 | Dominican Republic | 4.594 |
| 10 | Honduras | 3.769 |
Worth noting that reducing fees for remittances is a goal long held by the UN. It’s as if they expect and promote mass migration to the West.
7. “Inadmissibles” Still Allowed In Canada
| Year | Permits | Cumulative |
|---|---|---|
| 2002 | 12,630 | 12,630 |
| 2003 | 12,069 | 24,699 |
| 2004 | 13,598 | 38,297 |
| 2005 | 13,970 | 52,267 |
| 2006 | 13,412 | 65,679 |
| 2007 | 13,244 | 78,923 |
| 2008 | 12,821 | 91,744 |
| 2009 | 15,640 | 107,384 |
| 2010 | 12,452 | 119,836 |
| 2011 | 11,526 | 131,362 |
| 2012 | 13,564 | 144,926 |
| 2013 | 13,115 | 158,041 |
| 2014 | 10,624 | 168,665 |
| 2015 | 10,333 | 178,998 |
| 2016 | 10,568 | 189,566 |
| 2017 | 9,221 | 198,787 |
Using the 2004 to 2018 Annual Reports to Parliament on Immigration, we can see that almost 199,000 people who were previously deemed “inadmissible to Canada” were still allowed Temporary Residence Permits since 2002. This is being done under Rule 24(1) of the Immigration and Refugee Protection Act.
Global(ist) News recently reported about the 3,000 or so who were allowed in under a 2010 rule change, and Rule 25.1 of IRPA. However, they missed the bigger picture.
SEC = Security (espionage, subversion, terrorism)
HRV = Human or International Rights Violations
CRIM = Criminal
S.CRIM = Serious Criminal
NC = Non Compliance
MR = Misrepresentation
| YEAR | Total | SEC | HRV | Crim | S.Crim | NC | MR |
|---|---|---|---|---|---|---|---|
| 2002 | 12,630 | ? | ? | ? | ? | ? | ? |
| 2003 | 12,069 | 17 | 25 | 5,530 | 869 | 4,855 | 39 |
| 2004 | 13,598 | 12 | 12 | 7,096 | 953 | 4,981 | 20 |
| 2005 | 13,970 | 27 | 15 | 7,917 | 981 | 4,635 | 21 |
| 2006 | 13,412 | 29 | 20 | 7,421 | 982 | 4,387 | 18 |
| 2007 | 13,244 | 25 | 8 | 7,539 | 977 | 4,109 | 14 |
| 2008 | 12,821 | 73 | 18 | 7,108 | 898 | 4,170 | 17 |
| 2009 | 15,640 | 32 | 23 | 6,619 | 880 | 7,512 | 10 |
| 2010 | 12,452 | 86 | 24 | 6,451 | 907 | 4,423 | 36 |
| 2011 | 11,526 | 37 | 14 | 6,227 | 899 | 3,932 | 11 |
| 2012 | 132,474 | 20 | 15 | 7,014 | 888 | 5,206 | 18 |
| 2013 | 145,589 | 17 | 10 | 6,816 | 843 | 5,135 | 8 |
| 2014 | 10,624 | 12 | 2 | 5,807 | 716 | 3,895 | 14 |
| 2015 | 10,333 | 3 | 3 | 5,305 | 578 | 4,315 | 28 |
| 2016 | 10,568 | 8 | 4 | 4,509 | 534 | 2,788 | 20 |
| 2017 | 9,221 | 10 | 5 | 5,035 | 591 | 3,412 | 121 |
This is correct. People being denied entry for criminal record, serious criminal records, human rights violations, security risks, terrorism, and the like, are still being given Temporary Residence Permits.
For all those who say “come legally” and it’s okay, guess what? These people are being let into Canada legally. It’s the system that’s broken. Virtually anyone can get into Canada, so should we just skip the formality of having a border?
8. Importing The 3rd World
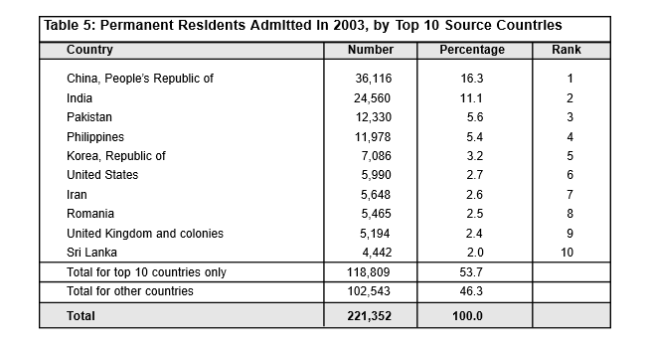
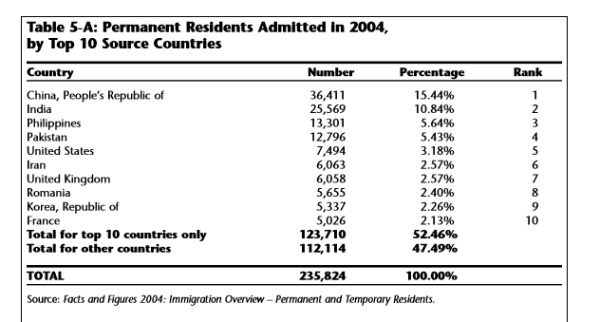
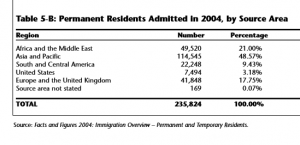
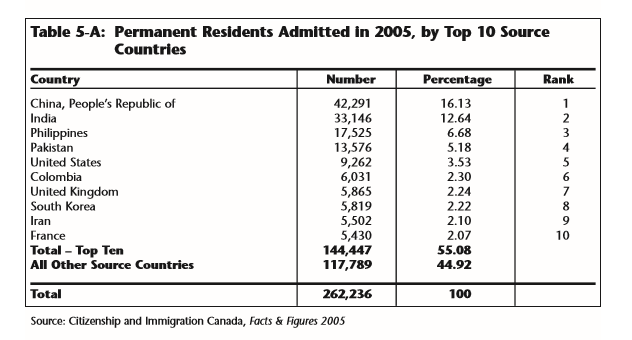
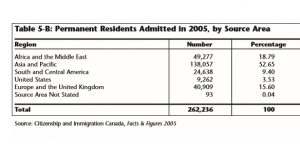
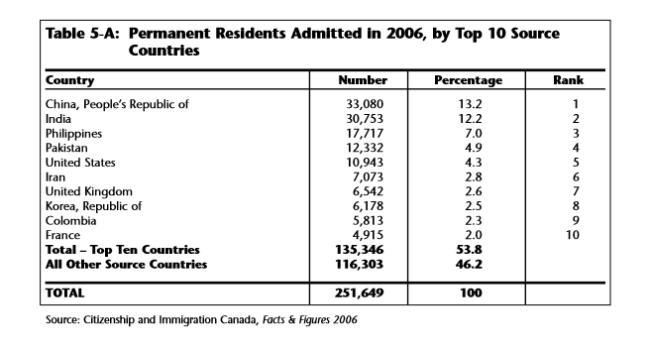
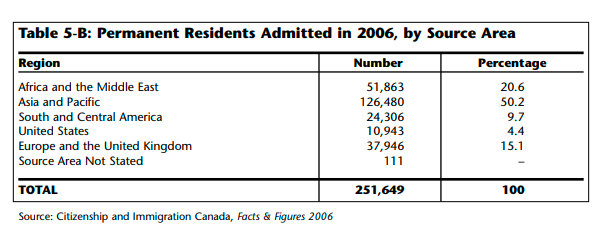
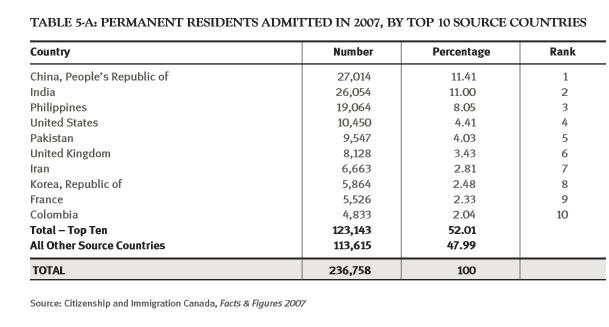
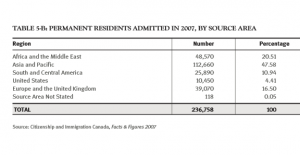
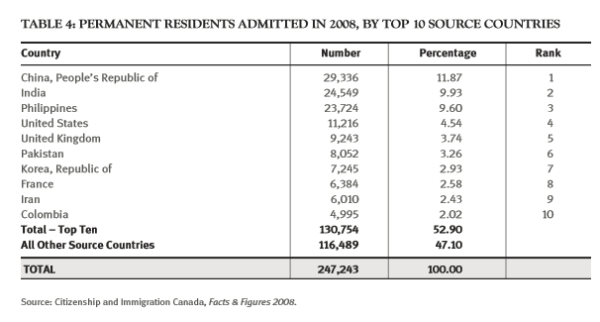
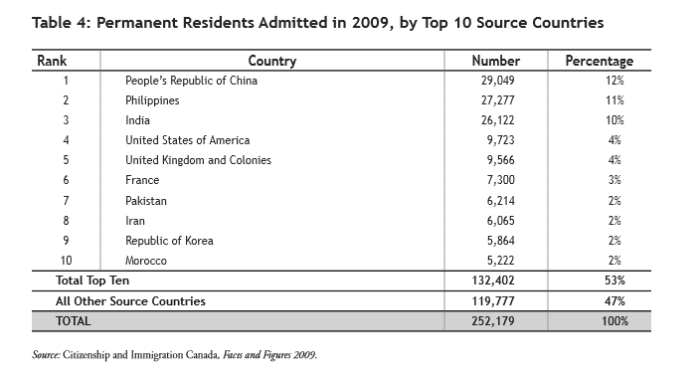
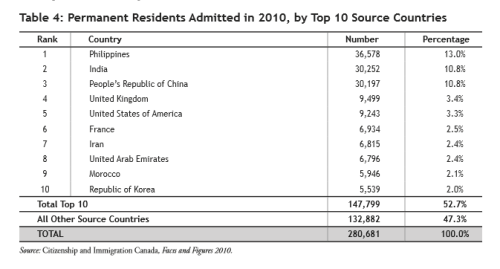
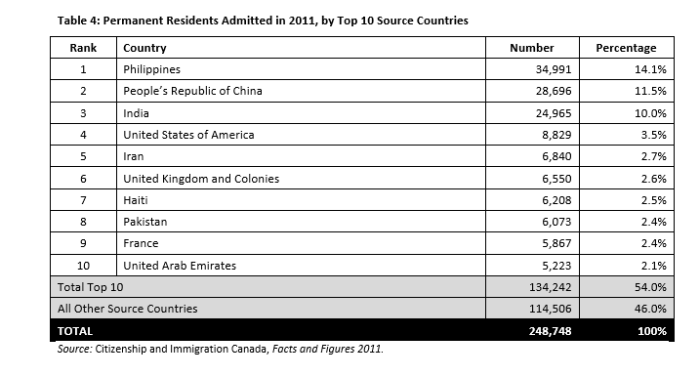
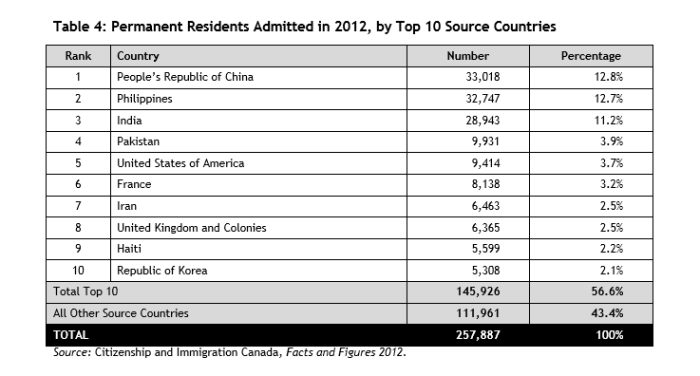
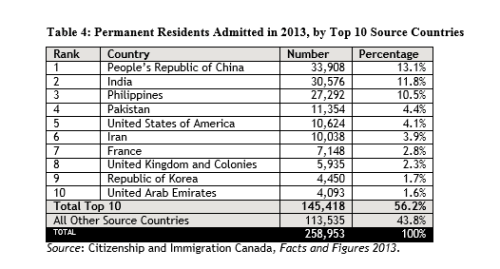
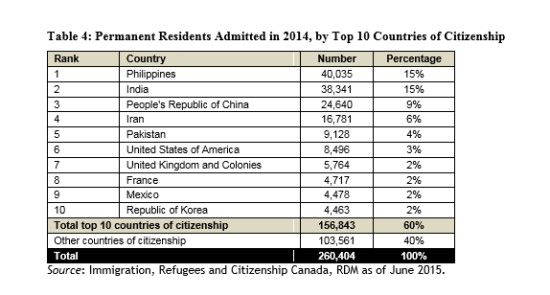
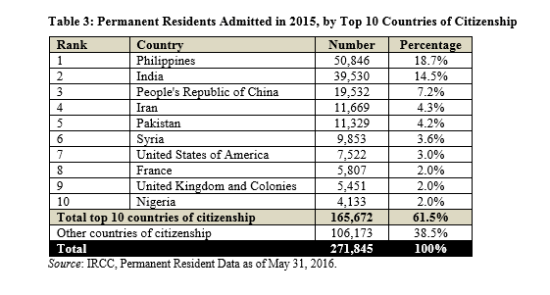
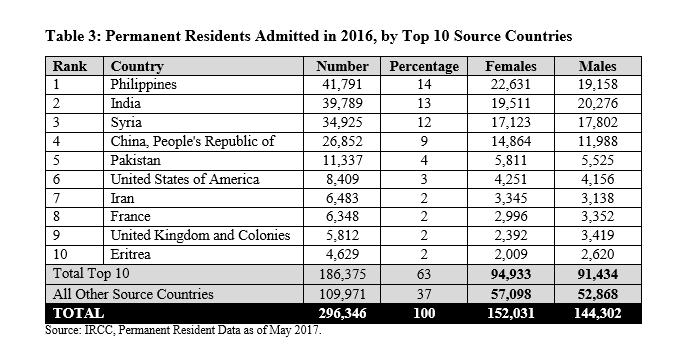
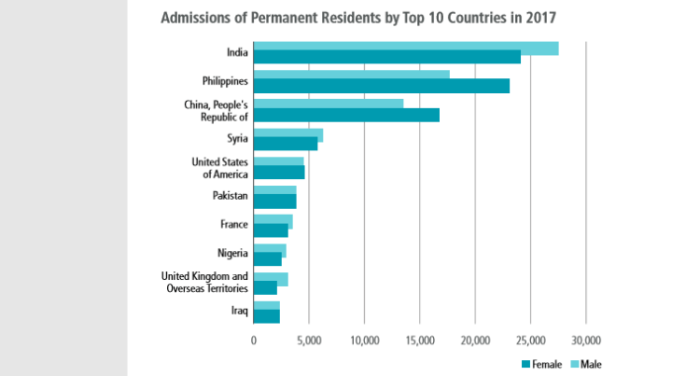
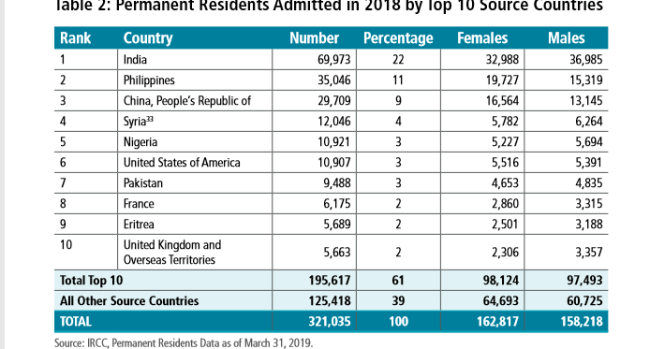
The tables below are composed form data gathered in the Annual Immigration Reports to Parliament (see Section #3). While this data related to % of people gaining permanent residence, and which countries they originate from, it’s a pretty good indicator of where Canada is importing people from.
(Below: PR, top 10 countries of origin in 2004 Report)
| Rank | Country | Percent (%) |
|---|---|---|
| #1 | China | 16.3 |
| #2 | India | 11.1 |
| #3 | Pakistan | 5.6 |
| #4 | Philippines | 5.4 |
| #5 | S. Korea | 3.2 |
| #6 | U.S. | 2.7 |
| #7 | Iran | 2.6 |
| #8 | Romania | 2.5 |
| #9 | U.K. & Colonies | 2.4 |
| #10 | Sri Lanka | 2.0 |
(Below: PR, top 10 countries of origin in 2007 Report)
| Rank | Country | Percent (%) |
|---|---|---|
| #1 | China | 13.2 |
| #2 | India | 12.2 |
| #3 | Philippines | 7.0 |
| #4 | Pakistan | 4.9 |
| #5 | U.S.A. | 4.3 |
| #6 | Iran | 2.8 |
| #7 | U.K. | 2.6 |
| #8 | S. Korea | 2.5 |
| #9 | Colombia | 2.3 |
| #10 | France | 2.0 |
(Below: PR, top 10 countries of origin in 2010 Report)
| Rank | Country | Percent (%) |
|---|---|---|
| #1 | China | 12 |
| #2 | Philippines | 11 |
| #3 | India | 10 |
| #4 | U.S.A | 4 |
| #5 | U.K. & Colonies | 4 |
| #6 | France | 3 |
| #7 | Pakistan | 2 |
| #8 | Iran | 2 |
| #9 | S. Korea | 2 |
| #10 | Morocco | 2 |
(Below: PR, top 10 countries of origin in 2013 Report)
| Rank | Country | Percent (%) |
|---|---|---|
| #1 | China | 12.8 |
| #2 | Philippines | 12.7 |
| #3 | India | 11.2 |
| #4 | Pakistan | 3.9 |
| #5 | U.S.A | 3.7 |
| #6 | France | 3.2 |
| #7 | Iran | 2.5 |
| #8 | U.K. & Colonies | 2.5 |
| #9 | Haiti | 2.2 |
| #10 | S. Korea | 2.1 |
(Below: PR, top 10 countries of origin in 2016 Report)
| Rank | Country | Percent (%) |
|---|---|---|
| #1 | Philippines | 18.7 |
| #2 | India | 14.5 |
| #3 | China | 7.2 |
| #4 | Iran | 4.3 |
| #5 | Pakistan | 4.2 |
| #6 | Syria | 3.6 |
| #7 | U.S.A. | 3.0 |
| #8 | France | 2.0 |
| #9 | U.K. & Colonies | 2.0 |
| #10 | Nigeria | 2.0 |
Note: Of the top 10 countries of origin, only 3 are from European, Western nations (France, the U.S., and the U.K. & Colonies). However, ever U.K. & Colonies is suspect, as it contains people from outside the U.K.
Who would have thought that mass migration of the 3rd World would lead to Canada becoming the 3rd World? This connection is obviously so difficult to make.
This isn’t everyone who stays in Canada, and certainly not everyone who enters Canada. However, it does provide a glimpse into WHERE people are coming from. Canada is importing the 3rd World, and becoming the 3rd World as a result.
(Page 18 of the 2004 Annual Report to Parliament)
(Page 24 of the 2005 Annual Report to Parliament)
(Page 18, 19 of the 2006 Annual Report to Parliament)
(Page 19, 20 of the 2007 Annual Report to Parliament)
(Page 21, 22 of the 2008 Annual Report to Parliament)
(Page 16 of the 2009 Annual Report to Parliament)
(Page 14 of the 2010 Annual Report to Parliament)
(Page 18 of the 2011 Annual Report to Parliament)
(Page 15 of the 2012 Annual Report to Parliament)
(Page 19 of the 2013 Annual Report to Parliament)
(Page 16 of the 2014 Annual Report to Parliament)
(Page 16 of the 2015 Annual Report to Parliament)
(Page 10 of the 2016 Annual Report to Parliament)
(Page 14 of the 2017 Annual Report to Parliament)
(Page 28 of the 2018 Annual Report to Parliament)
(Page 36 of the 2019 Annual Report to Parliament)
Did you think that importing large numbers of people from:
(a) China
(b) India
(c) Philippines
(d) Pakistan
(e) Iran
might be the reason we have such large enclaves of these groups? Think there may be some connection between them? This is not a single year, but a consistent pattern.
9. White Genocide In Action
| Year | Population | % of Canada |
|---|---|---|
| 1871 | 3,433,315 | 98.5% |
| 1881 | 4,146,900 | 95.9% |
| 1901 | 5,170,522 | 96.0% |
| 1911 | 7,005,583 | 94.35% |
| 1921 | 8,568,584 | 96.0% |
| 1931 | 10,134,313 | 97.7% |
| 1941 | 11,242,868 | 97.8% |
| 1951 | 13,582,574 | 96.83% |
| 1961 | 17,653,864 | 96.8% |
| 1966 | – | 96.8% |
| 1971 | 20,763,915 | 96.3% |
| 1981 | 22,402,000 | 93.0% |
| 1986 | – | – |
| 1986 | – | – |
| 1996 | 24,531,635 | 86.0% |
| 2001 | 24,678,880 | 83.3% |
| 2006 | 25,000,155 | 80.0% |
| 2011 | 25,186,890 | 76.7% |
| 2016 | 25,111,695 | 72.9% |
Based off the Wikipedia page, it’s sources are: here, here, here, here, here, here, and here.
To point out the obvious, yes the data table is incomplete. There are a few years missing. However, the overall trend shows an undeniable pattern towards those of European descent declining as a percentage and losing voting power.
Euro Canadians will be a minority in about a decade or so. How well will we be treated then?
10. Truth About Birth Rates
Live Births in Canada: 2013 – 2017
Deaths in Canada: 2013 – 2017
| Year | Birth | Deaths | Diff | Day |
|---|---|---|---|---|
| 1991 | 402,533 | 195,569 | 206,964 | 567 |
| 1992 | 398,643 | 196,535 | 202,108 | 552 |
| 1993 | 388,394 | 204,912 | 183,482 | 503 |
| 1994 | 385,114 | 207,077 | 178,037 | 488 |
| 1995 | 378,016 | 210,733 | 167,283 | 458 |
| 1996 | 366,200 | 212,880 | 153,320 | 419 |
| 1997 | 348,598 | 215,669 | 132,929 | 364 |
| 1998 | 342,418 | 218,091 | 124,327 | 341 |
| 1999 | 337,249 | 219,530 | 117,719 | 323 |
| 2000 | 327,882 | 218,062 | 109,820 | 300 |
| 2001 | 333,744 | 219,538 | 114,206 | 313 |
| 2002 | 328,802 | 223,603 | 105,199 | 288 |
| 2003 | 335,202 | 226,169 | 109,033 | 299 |
| 2004 | 337,072 | 226,584 | 110,488 | 302 |
| 2005 | 342,176 | 230,132 | 112,044 | 307 |
| 2006 | 354,617 | 228,079 | 126,538 | 347 |
| 2007 | 367,864 | 235,217 | 132,647 | 363 |
| 2008 | 377,886 | 238,617 | 139,269 | 381 |
| 2009 | 380,863 | 238,418 | 142,445 | 390 |
| 2010 | 377,213 | 240,075 | 137,138 | 376 |
| 2011 | 377,636 | 243,511 | 134,125 | 367 |
| 2012 | 381,869 | 246,596 | 135,273 | 370 |
| 2013 | 380,323 | 252,338 | 127,985 | 350 |
| 2014 | 384,100 | 258,821 | 125,279 | 343 |
| 2015 | 382,392 | 264,333 | 118,059 | 323 |
| 2016 | 383,102 | 267,213 | 115,889 | 318 |
| 2017 | 379,450 | 276,689 | 102,761 | 281 |
| 2018 | 375,390 | 283,706 | 91,684 | 251 |
It’s a commonly repeated myth that the Canadian population is declining. In fact, it is growing by about an average of 300 people per day, and has for several years. That being said, this is not at the same across groups. Couples European descent have an average of about 1.5 children each, far below the replacement rate.
Truth is demographic replacement is already taking place, even without any immigration. And that leads to the next segment: a groups that WANTS to breed, in order to achieve its goal of world domination.
11. Muslims Taking Over The World
(Muslims man bragging that demographic change will lead to Sharia Law replacing Canadian Law at some point)
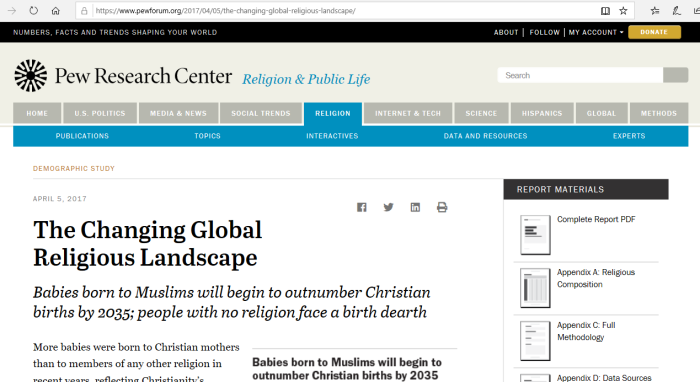
This man isn’t kidding about Islam becoming the biggest religious group. The goal is world domination, and they are breeding their way to get it. These findings, from Pew Research.
Babies born to Muslims will begin to outnumber Christian births by 2035; people with no religion face a birth dearth.
More babies were born to Christian mothers than to members of any other religion in recent years, reflecting Christianity’s continued status as the world’s largest religious group. But this is unlikely to be the case for much longer: Less than 20 years from now, the number of babies born to Muslims is expected to modestly exceed births to Christians, according to new Pew Research Center demographic estimates.
Muslims are projected to be the world’s fastest-growing major religious group in the decades ahead, as Pew Research Center has explained, and signs of this rapid growth already are visible. In the period between 2010 and 2015, births to Muslims made up an estimated 31% of all babies born around the world – far exceeding the Muslim share of people of all ages in 2015 (24%).
The current age distribution of each religious group is an important determinant of demographic growth. Some groups’ adherents are predominantly young, with their prime childbearing years still ahead, while members of other groups are older and largely past their childbearing years. The median ages of Muslims (24 years) and Hindus (27) are younger than the median age of the world’s overall population (30), while the median age of Christians (30) matches the global median. All the other groups are older than the global median, which is part of the reason why they are expected to fall behind the pace of global population growth.
He’s not wrong at all. Pew Research is predicting exactly that. Muslims will become the biggest religious group in a short time.
Of course, the fact that they murder: Christians, Jews, Buddhists, Atheists, gays, blasphemers, apostates, and different sects of Islam “might” have something to do with those changing demographics. They aren’t exactly tolerant.
12. UN Supports Replacement, White Genocide
This topic was covered previously, but time for a trip down memory lane. The United Nations has been holding “population conferences” since the 1950s. Interestingly, the solution is always the same: more migration from the 3rd World. Not higher birth rates. Not a decline may be okay. Not “piss off” as a response. More mass migration.
(UN considers replacement migration — not higher birthrates — to be the solution to declining populations)
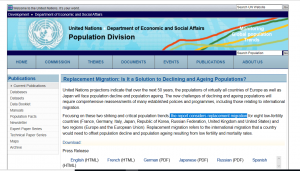
(UN Population Division still hard at work)
UN webpages worth a read
CLICK HERE, for the UN Population Division website.
CLICK HERE, for the UN research into replacement migration
CLICK HERE, for Gov’t views & policies.
CLICK HERE, for participant contact info.
CLICK HERE, for Russian replacement migration.
CLICK HERE, for European replacement migration.
CLICK HERE, for Korean population decline.
CLICK HERE, for various conferences.
CLICK HERE, for the “About” page.
CLICK HERE, for “resolutions” from the UN Population Division.
CLICK HERE, for UN Convention on Prevention and Punishing Genocide.
CLICK HERE, for the UN Global Migration Compact.
UN Global Migration Group
- Food and Agricultural Organization (FAO)
- International Labour Organization (ILO)
- International Organization for Migration (IOM)
- Office of the High Commissioner for Human Rights (OHCHR)
- United Nations Children’s Fund (UNICEF)
- United Nations Conference on Trade and Development (UNCTAD)
- United Nations Department of Economic and Social Affairs (DESA)
- United Nations Development Programme (UNDP)
- United Nations Educational, Scientific and Cultural Organization (UNESCO)
- United Nations Entity for Gender Equality and the Empowerment of Women (UN Women)
- United Nations Institute for Training and Research (UNITAR)
- United Nations High Commissioner for Refugees (UNHCR)
- United Nations Office on Drugs and Crime (UNODC)
- United Nations Population Fund (UNFPA)
- United Nations Regional Commissions
- United Nations University (UNU)
- World Bank
- World Health Organization (WHO)
Not much to add to this abomination, but it is plain and obvious that the replacement agenda is going on at a global level, and has been for decades.
Consider this: the UN was formed at the end of the Second World War in 1945. Less than a decade later, it is already holding population conferences. They continue even now.
13. Multiculturalism Is Genocide
This may seem strange, but consider the following. Forcibly remaking the population without their consent amounts to genocide, as defined by the United Nations. Check out the UN Convention On Prevention and Punishing Genocide.
Article I
The Contracting Parties confirm that genocide, whether committed in time of peace or in time of war, is a crime under international law which they undertake to prevent and to punish.
Article II
In the present Convention, genocide means any of the following acts committed with intent to destroy, in whole or in part, a national, ethnical, racial or religious group, as such:
(a) Killing members of the group;
(b) Causing serious bodily or mental harm to members of the group;
(c) Deliberately inflicting on the group conditions of life calculated to bring about its physical destruction in whole or in part;
(d) Imposing measures intended to prevent births within the group;
(e) Forcibly transferring children of the group to another group.
Article III
The following acts shall be punishable:
(a) Genocide;
(b) Conspiracy to commit genocide;
(c) Direct and public incitement to commit genocide;
(d) Attempt to commit genocide;
(e) Complicity in genocide.
Article IV
Persons committing genocide or any of the other acts enumerated in article III shall be punished, whether they are constitutionally responsible rulers, public officials or private individuals.
Article V
The Contracting Parties undertake to enact, in accordance with their respective Constitutions, the necessary legislation to give effect to the provisions of the present Convention, and, in particular, to provide effective penalties for persons guilty of genocide or any of the other acts enumerated in article III.
Article VI
Persons charged with genocide or any of the other acts enumerated in article III shall be tried by a competent tribunal of the State in the territory of which the act was committed, or by such international penal tribunal as may have jurisdiction with respect to those Contracting Parties which shall have accepted its jurisdiction.
Article VII
Genocide and the other acts enumerated in article III shall not be considered as political crimes for the purpose of extradition.
The Contracting Parties pledge themselves in such cases to grant extradition in accordance with their laws and treaties in force.
14. Where To Go From Here
A moratorium on immigration is the only sensible answer. This “multiculti” experiment is a total failure, and it’s time to put a stop to it. Illegals need to be deported.
Stop Islamic immigration. Permanently. Deport whoever can be legally deported, and ban political Islam. Mosques need to be shutdown wherever possible.
This multicultural push also needs to go. If Canada (or any nation) is to survive, it must be united under one identity.
How did we get to the stage where replacing your population, your culture, language, traditions, and customs is valued as “diversity”? Shouldn’t we preserve what we have?
Put our own people first. Have our own children, more of them, and keep the culture (what’s left of it) intact. Stop sending money away with remittances, stop importing cheap labour, and driving down wages.
It is mind boggling that so-called “conservatives” keep pushing for mass migration from socialist and other left leaning nations. It never seems to dawn on them that importing liberal and socialist voters means that their own base will eventually be replaced. Idiots. But who cares, as long as the cheap labour keeps flowing.
Discover more from Canuck Law
Subscribe to get the latest posts sent to your email.