

Canadians have wondered how the scale of “temporary” foreign workers has skyrocketed in recent years. Here, we’ll try to answer at least some of it, using an interesting case.
Restaurant Brands International Inc. is a company that boasts of “$40 billion in annual system-wide sales and over 30,000 restaurants in more than 100 countries”. It owns:
- Tim Hortons
- Burger King
- Popeyes
- Firehouse Subs
Tim Hortons is perhaps the most well known chain, or at least one of them. It’s also where the prevalence of foreign workers is one of the most noticeable. Now, why has this been happening?
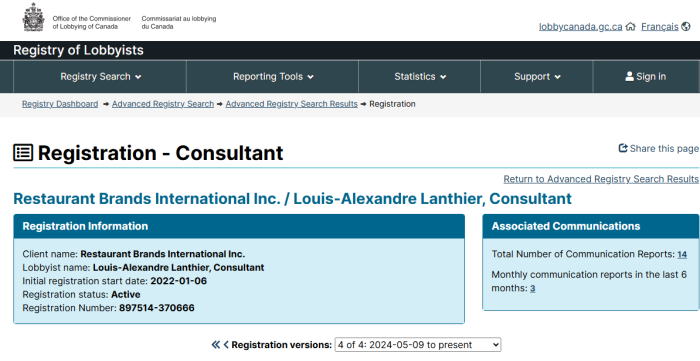
It should surprise no one that corporations lobby governments all the time to change laws that suit their needs. This is no different. However, we can at least track official communications, and see what they’ve been talking about.
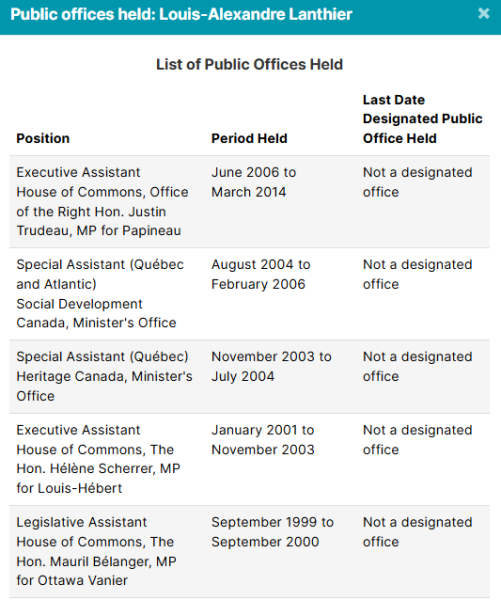
Louis-Alexandre Lanthier, a consultant with PAA Public Affairs Advisors, is a former campaign manager for Justin Trudeau. Yes, this is the sitting Prime Minister.
In their “services” section, PAA lists the following:
- Government advisory services – The art of persuading government involves intervening early, helping often, and supporting your arguments with evidence. We work at all levels of the political system, among public servants and with influential stakeholders, to gather intelligence and create a consensus about the best path forward.
- Corporate communications – We offer the full gamut of corporate communications services from carefully crafted PR programs to print, broadcast and digital ad campaigns and social media. We help our clients communicate both internally and externally. Whatever the medium, we are gifted at the fine art of communication.
- Media relations – For over a decade, we have been nurturing powerful relationships with journalists and media executives across Canada, so we can help educate various audiences about issues important to our clients. We are experts in everything from writing releases and staging press conferences to amassing earned media and leveraging it on all the requisite social media channels.
- Crisis communications – How an organization responds to a crisis reveals its character. PAA helps clients navigate difficult situations to help ensure that their reputations emerge not just intact but enhanced. We have expertise handling all manner of crises, including: product recalls; executive departures; site specific incidents; cyber and ransomware attacks; and data breaches.
- Stakeholder relations – Stakeholder relations are as important as any other. After careful collaboration with our clients, we are adept at handling investor, board, employee and partner relations. Our success in these areas relies on communicating clearly, concisely, and often, and, of course, on listening.
Cute, isn’t it? They “work to create a consensus”, all while “educating various audiences” on important issues. Sure, the information is public, but how many people actually research this sort of thing?
As an aside, this isn’t unique to Liberals. Lobbying firms reach out to politicians of all stripes. What this means is that even when there’s a change in administration, there’s still a lobbyist who can reach out. Voting Conservative won’t save you.
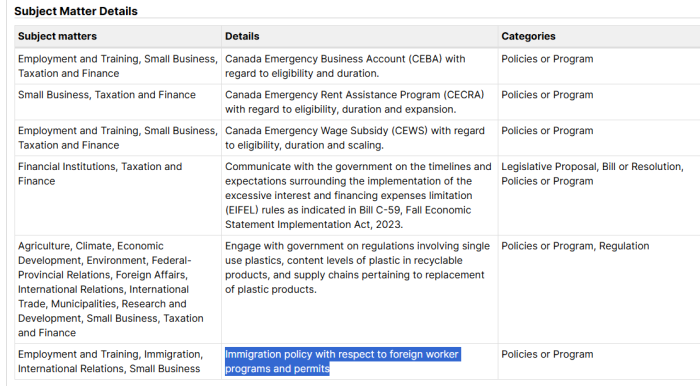
Let’s look at that last part again:
Interestingly, lobbyists also pushed Ottawa for bailout money, such as CEWS, or the Canada Emergency Wage Subsidy. Now, while they get extra tax breaks from Canada, they push for changes to replace them from the workforce.
The Lobbying Registry is a gold mine of information, and it lends real insight as to who is pulling the strings of politicians. There are Provincial ones as well.
So, who is Louis-Alexandre Lanthier?


It’s all available on his LinkedIn page, as well as his PAA profile. Influence peddling has become so prevalent that no one bothers to hide it anymore.
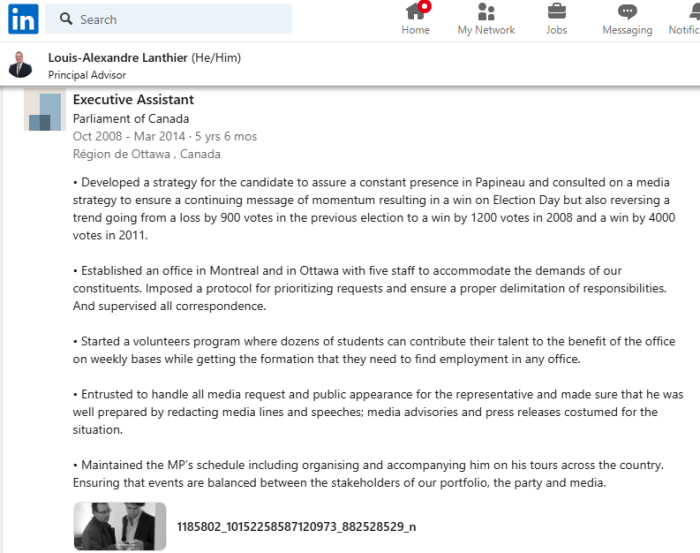
Executive Assistant
Parliament of Canada
Oct 2008 to Mar 2014 · 5 yrs 6 mos
Région de Ottawa, Canada
• Developed a strategy for the candidate to assure a constant presence in Papineau and consulted on a media strategy to ensure a continuing message of momentum resulting in a win on Election Day but also reversing a trend going from a loss by 900 votes in the previous election to a win by 1200 votes in 2008 and a win by 4000 votes in 2011.
• Established an office in Montreal and in Ottawa with five staff to accommodate the demands of our constituents. Imposed a protocol for prioritizing requests and ensure a proper delimitation of responsibilities. And supervised all correspondence.
• Started a volunteers program where dozens of students can contribute their talent to the benefit of the office on weekly bases while getting the formation that they need to find employment in any office.
• Entrusted to handle all media request and public appearance for the representative and made sure that he was well prepared by redacting media lines and speeches; media advisories and press releases costumed for the situation.
• Maintained the MP’s schedule including organising and accompanying him on his tours across the country. Ensuring that events are balanced between the stakeholders of our portfolio, the party and media.
That was from LinkedIn. His work profile states:
Based in PAA’s Ottawa office, Louis-Alexandre brings over 25 years from government and corporate experience to his role as Principal Advisor and Sector Lead, Supply Chain & Transportation, including seven years in the office of Liberal Leader Justin Trudeau.
Previously, Louis-Alexandre led Government Affairs for a large transportation corporation, advising clients representing varied interests in sectors such as information technology, transport, infrastructure, trades, communication, and health. He is part of a small group of people who have more than 20 years of experience on Parliament Hill. He has worked with the public service, politicians, political parties, interest groups and stakeholders on a wide variety of political and policy issues. During his years with Mr. Trudeau — from 2007 to 2014 — he was responsible for the overall management of the Ottawa and Montreal offices, including managing the office budget and staff as well as acting as a media liaison and spokesperson, in both official languages.
Louis-Alexandre and his husband are the proud adoptive parents of a wonderful son. They enjoy the excitement of outdoor activities and all the family amenities that the great city of Ottawa has to offer.
To state the obvious: Tim Hortons and Restaurant Brands International Inc. are hardly the only places to be pushing for the replacement of Canadian workers. It’s happening everywhere. Still, the coziness of politicians and big business are troubling to see.
Stephen Yardy is another RBI consultant. His LinkedIn profile states that he was an NDP campaign organizer from 2008 until 2022. According to the Lobbying Registry, his primary goal appears to be foreign worker permits and immigration issues. In other words, flood Canada with cheaper labour in order to drive down wages and increase profits.
Andrew Teliszewsky is another one with RBI Inc., though his listed areas of concern had to do with income taxation and interest deductibility. His LinkedIn profile states that he held several Government roles in Ontario, including when Dalton McGuinty was Premier.
Éric Lamoureux is yet another one of the lobbyists. But something more interesting about him is his role in lobbying Quebec to lean on Ottawa to cut SNC Lavalin a break over corruption charges. Though he’s apparently no longer with PAA, the archived version is still there.
Based in Montréal, Éric draws on deep expertise in politics and public administration to help clients protect and promote their interests in Canada and Québec. As a specialist in issues management, regulatory affairs, stakeholder relations and media relations, Éric has achieved many notable successes on behalf of his clients, including: helping a global financial services company safeguard its market position in the face of regulatory change; mobilizing the support of a provincial government to pressure for changes to the federal Criminal Code on a client’s behalf; and encourage a major Canadian municipal government to reverse a decision to construct a public building beside a client facility.
It takes a special kind of bold to put in one’s work profile that (one of) their biggest accomplishments was sweet-talking on the Quebec Government into putting pressure on Ottawa over a corporate client facing criminal charges. That client, of course, was SNC Lavalin.
Keep in mind, there are currently programs in place to have taxpayers subsidize the majority of the wages of foreign workers coming to Canada. This means that the public is forced to foot the bill for their own replacement.
In any event, this is nowhere near the complete list of influence peddlers trying to bring in endless amounts of “temporary” workers. But it does go to show just how high up the rot is.
(0) https://www.rbi.com/English/brands/default.aspx
(1A) https://www.linkedin.com/in/louis-alexandre-lanthier-75517b3b/
(1B) Louis-Alexandre Lanthier LinkedIn Profile
(1C) https://lobbycanada.gc.ca/app/secure/ocl/lrs/do/vwRg?cno=370666®Id=951762
(1D) https://paainc.ca/
(1E) https://paainc.ca/team/louis-alexandre-lanthier/
(2A) https://www.linkedin.com/in/stephen-yardy-b0a4a326/
(2B) Stephen Yardy LinkedIn Profile
(2C) https://lobbycanada.gc.ca/app/secure/ocl/lrs/do/vwRg?cno=373452®Id=949610
(3A) https://www.linkedin.com/in/andrew-teliszewsky-3b6b39171/
(3B) Andrew Teliszewsky LinkedIn Profile
(3C) https://lobbycanada.gc.ca/app/secure/ocl/lrs/do/vwRg?cno=375563®Id=950475
(4A) https://www.linkedin.com/in/ericlamoureux/
(4B) Eric Lamoureux LinkedIn Profile
(4C) https://lobbycanada.gc.ca/app/secure/ocl/lrs/do/vwRg?cno=373267®Id=954552
(4D) Wayback Machine Archive
(4E) Eric Lamoureux Public Affairs Advisors