
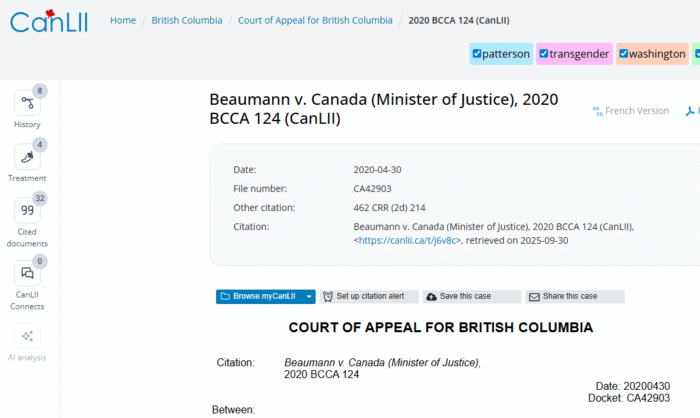
Let’s look at an older case that’s still applicable today. Haedyn-Khris Racquel Beaumann, (or Patterson?) whose real name is Kevin David Patterson, fled to British Columbia after committing murder back in 2014. To avoid extradition to Washington State, he filed endless legal challenges. Eventually, he resorted to playing the “transgender” card, in order to further delay.
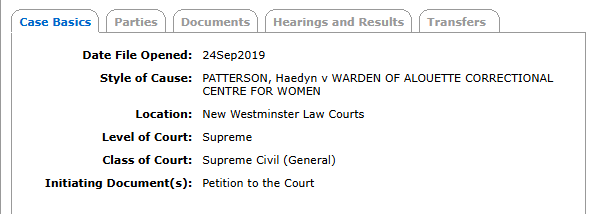
While the case was (more broadly) covered over the years, reporting didn’t really address the specific allegations of how Patterson acted in custody. He managed to get transferred to the Alouette Correctional Centre for Women, or ACCW. It’s shocking what the staff tolerated, and how little the safety of the women trapped with him mattered.
Also see Bagnald and Blackplume for some of the other psychos that are locked up.
Female Prison To Be Staffed By Female Guards
9. As a general matter, females are housed separately from men in British Columbia’s correctional system. As is explicitly acknowledged by BC Corrections in a document entitled “Statement of Philosophy – Correctional Service for Women,” female inmates tend to have backgrounds, needs, and safety concerns that are distinct from male inmates. Notably, many female inmates have historically suffered abuse at the hands of men, and as a result of this trauma are more vulnerable and susceptible to ongoing and future trauma and abuse.
34. In accordance with the Cross Gender Staffing Policy, all front-line correctional officers at ACCW are female. These officers are responsible for supervising the inmate population on the units, doing visual safety checks of inmates in all areas of the centre, including individual cells, performing physical searches, taking escorts into the community, facilitating programs, etc. The few male staff members at ACCW are either supervisors or managers.
35. The majority of the inmates at ACCW have suffered from violence or other forms of abuse by men, tend to be marginalized, are more likely to be easily controlled or overpowered by men, and have high levels of trauma.
36. There are many challenges to managing the inmate population at ACCW. Ensuring the safety and security of staff and inmates in the context of a correctional centre is a complex balancing act. One of the biggest challenges staff face is managing the interaction among inmates to prevent or minimize tensions and conflict among them, and to protect vulnerable inmates from being taken advantage of.
Then, there’s this nonsense:
“51. Transgender inmates at SPSC are welcome to wear wigs or prosthetics in accordance with their gender expression, though BC Corrections does not supply these items. All inmates at SPSC must, however, wear the same outer clothing for safety and security reasons.”
The Response to the Petition is interesting. It’s stated quite plainly that with the odd exception in management, the staff is female. This is due largely to trauma and violence inmates have suffered. And it’s all perfectly reasonable.
However, this logic completely falls by the wayside when it’s explained that male prisoners can simply call themselves women and be transferred there. Guards at least are subjected to a high level of background checks, whereas anyone can be an inmate.
Patterson got himself transferred to the Alouette Correctional Centre for Women in Surrey, B.C. But because of how he acted, he was eventually sent back. He challenged the decision.
ACCW admits that they had at least 15 transgender prisoners between 2016 and 2019. So, this isn’t a one-off, but is a regular concern. But what about the women there?
Alouette Explains Reasons For Sending Patterson Back
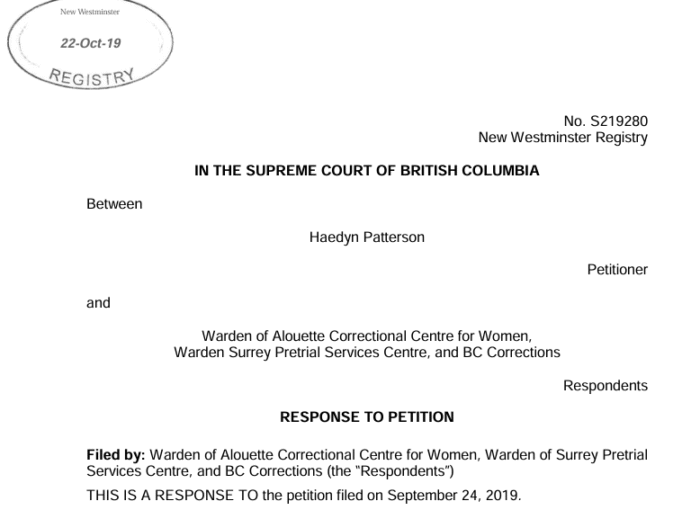
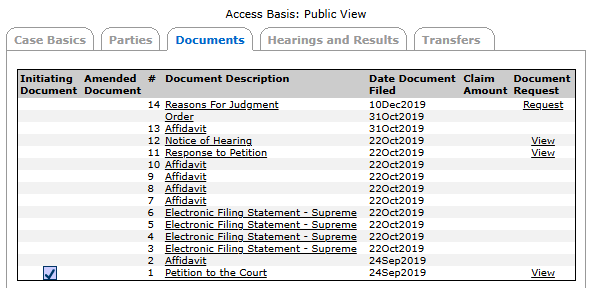
In response to Patterson’s Petition, the prison filed a formal reply. It outlined in detail the problems that they had with him.
59. In late 2017 (i.e. after three years in custody), while incarcerated at SPSC, the petitioner informed BC Corrections for the first time that she identifies as female. The petitioner was transferred from SPSC to ACCW on September 12, 2018.
60. Prior to her transfer to ACCW, the petitioner was required to sign a “Behavioural Expectations Contract”. These are sometimes used where an inmate has demonstrated negative behaviour and BC Corrections staff determine a behavioural expectations contract may assist in correcting that behaviour. The terms of the contract ensure inmates have a clear understanding of what is expected of them and to provide a clear behavioural plan for the inmate to follow.
64. During her stay at ACCW, Ms. Bryson worked closely with the petitioner to manage her behavioural issues and to support her compliance with the behavioural expectations at ACCW, as set out in her Behavioural Expectations Contract. Nevertheless, the petitioner’s behaviour proved extremely difficult to manage.
65. Throughout her time at ACCW, and despite Ms. Bryson’s efforts to work with the petitioner, the petitioner routinely engaged in disruptive behaviour that breached ACCW’s rules. These behaviours ranged from horseplay, prohibited intimate relationships with other inmates, disobeying staff direction, and behaving in an abusive manner toward others. By the time that she was transferred back to SPSC, there were 288 negative entries in her C-Log related to her time at ACCW.
66. In addition to these more routine examples of negative behaviour, there were four serious incidents involving the petitioner during her time at ACCW. These incidents, which took place on January 30, April 3, July 24 and August 14, 2019, demonstrated a pattern of repeated and significant misbehaviour that put the safety and security of the petitioner, ACCW staff, and other inmates at risk.
80. On August 14, 2019, Dr. Nader Sharifi, Medical Director of Correctional Health Services emailed ACCW’s Warden, Lisa Martin. Dr. Sharifi indicated that the petitioner had not been adhering to her transcare medication and that felt obligated to inform Ms. Martin of that fact as, in his view, it could endanger the safety at ACCW and its operations.
84. A Code Yellow was called and additional responding staff attended the scene. The petitioner was non-compliant and combative with staff. It eventually took eight staff members, including staff who are members of the Emergency Response Team, to restrain the petitioner with a “wrap” and move her to a harm reduction cell.
85. As a result of the petitioner’s combative behaviour on August 14, 2019, three staff members submitted Worker’s Compensation Claims for various injuries sustained during the code response including scratches, swelling, and injuries to the neck, knees, and back.
It’s difficult to believe that this went on. Prison staff knew in advance that Patterson was a serious problem. They also noted that “identifying as a woman” only set in after approximately 3 years in custody. And of course, he was wanted in the United States for first degree murder.
Not only was he transferred to ACCW, but allowed to remain there in spite of being a constant nuisance, menace, and danger to the women.
Patterson Threatened To Kill Staff, Other Inmates At ACCW
70. This incident was particularly concerning to ACCW staff. As noted above, the petitioner is facing extradition to the United States on a charge of first degree murder. One way to defeat an extradition proceeding is to be charged in Canada with a crime of equal or greater severity. Given this context, the petitioner’s comments “don’t forget I have nothing to lose” were taken very seriously.
Notwithstanding that he never should have been at ACCW to begin with, it’s mind boggling that he was allowed to remain for so long.
Timeline Of Major Events In Case
September 17th, 2014: Patterson commits murder and soon flees to Canada.
November 20th, 2014: The U.S. officially requested Patterson be extradited.
December 11th, 2014: The Minister of Justice authorized the extradition.
February 11th, 2015: British Columbia Supreme Court rejected Patterson’s application for bail. He had requested temporary release while extradition was being sorted out.
May 6th, 2015: At an extradition hearing, Justice gives oral reasons for committing Patterson into custody until the American authorities can get him.
July 20th, 2015: British Columbia Court of Appeal rejects a request to review the bail findings from earlier in the year. Patterson is to stay in custody.
October 17th, 2015: Minister of Justice orders unconditional surrender of Patterson.
February 3rd, 2017: British Columbia Court of Appeal dismissed an Appeal from the B.C. Supreme Court, which would have forced Patterson’s extradition to the U.S. The Court also refused an Application to consider new evidence.
Late 2017: Although no exact date is given, Patterson informs prison staff for the first time that he identifies as a woman.
March 15th, 2018: Supreme Court of Canada declined to hear an Appeal from the February 2017 decision of the BCCA.
September 12th, 2018: Patterson is transferred to ACCW.
December 7th, 2018: British Columbia Court of Appeal throws out Patterson’s Appeal.
July 11th, 2019: Supreme Court of Canada granted an extension of time to serve and file the Application for Leave, to challenge the December 2018 ruling. However, the Application itself was dismissed.
January 14th, 2020: British Columbia Court of Appeal rejects yet another request for interim release, pending extradition.
April 2nd, 2020: British Columbia Court of Appeal dismissed an Application by the Attorney General of Canada to have Patterson declared a “vexatious litigant”. However, it was noted that any further misuse of the Court may change their minds.
April 30th, 2020: British Columbia Court of Appeal dismisses Patterson’s Appeal of the January 24th, 2019 decision.
After exhausting all legal options in B.C., Patterson was eventually extradited. He was found guilty of murder.
One has to assume that the prison staff don’t want to put up with people like this. Patterson wasn’t even delusional, he was just gaming the system to avoid extradition for murder. To play devil’s advocate, perhaps the guards were trying to put together an extensive paper trail.
This sort of policy puts staff and prisoners alike in danger. Even if male inmates don’t injure or kill anyone, it’s still an intrusion that no one wants.
It’s apparently common practice to supply prisoners with synthetic hormones while they’re locked up. Not only to women have to contend with male prisoners, but they’re drugged up at the same time. It’s just asking for trouble.
There’s also the issue of all the expenses involved here. Patterson racked up huge legal bills, which taxpayers are presumably on the hook for.
COURT DOCUMENTS:
(1) Patterson Petition
(2) Patterson Response To Petition
(3) Patterson Notice Of Hearing