Review Of 2022 Annual Immigration Report To Parliament

With the end of this so-called “pandemic” in Canada, expect the agenda to move ahead. There were increases in every category in 2021 (compared to 2020). Expect this to get worse.

1. Mass LEGAL Immigration In Canada

Despite what many think, LEGAL immigration into Canada is actually a much larger threat than illegal aliens, given the true scale of the replacement that is happening. What was founded as a European (British) colony is becoming unrecognizable due to forced demographic changes. There are also social, economic, environmental and voting changes to consider. See this Canadian series, and the UN programs for more detail. Politicians, the media, and so-called “experts” have no interest in coming clean on this.

CLICK HERE, for UN Genocide Prevention/Punishment Convention.
CLICK HERE, for Barcelona Declaration & Kalergi Plan.
CLICK HERE, for UN Kalergi Plan (population replacement).
CLICK HERE, for UN replacement efforts since 1974.
CLICK HERE, for tracing steps of UN replacement agenda.

Note: If there are errors in calculating the totals, please speak up. Information is of no use to the public if it isn’t accurate.

2. Annual Immigration Reports To Parliament

2004 Annual Immigration Report To Parliament
2005 Annual Immigration Report To Parliament
2006 Annual Immigration Report To Parliament
2007 Annual Immigration Report To Parliament
2008 Annual Immigration Report To Parliament
2009 Annual Immigration Report To Parliament
2010 Annual Immigration Report To Parliament
2011 Annual Immigration Report To Parliament
2012 Annual Immigration Report To Parliament
2013 Annual Immigration Report To Parliament
2014 Annual Immigration Report To Parliament
2015 Annual Immigration Report To Parliament
2016 Annual Immigration Report To Parliament
2017 Annual Immigration Report To Parliament
2018 Annual Immigration Report To Parliament
2019 Annual Immigration Report To Parliament
2020 Annual Immigration Report To Parliament
2021 Annual Immigration Report To Parliament
2022 Annual Immigration Report To Parliament

The information in this article, and similar ones, comes directly from information provided by the Government of Canada in their annual reports. These numbers, while likely not truly accurate, are at least a good starting point.

3. Immigration Largely Controlled By Provinces

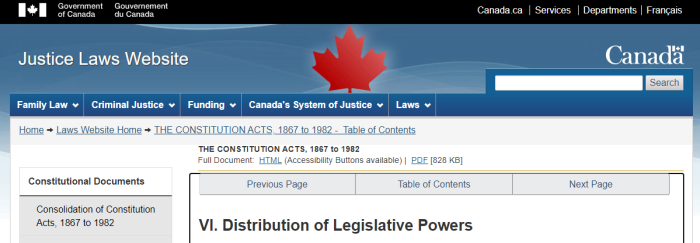
Concurrent Powers of Legislation respecting Agriculture, etc.
.
95 In each Province the Legislature may make Laws in relation to Agriculture in the Province, and to Immigration into the Province; and it is hereby declared that the Parliament of Canada may from Time to Time make Laws in relation to Agriculture in all or any of the Provinces, and to Immigration into all or any of the Provinces; and any Law of the Legislature of a Province relative to Agriculture or to Immigration shall have effect in and for the Province as long and as far only as it is not repugnant to any Act of the Parliament of Canada.

Contrary to popular belief, immigration is largely set by the Provinces. This is laid out in Section 95 of the Constitution. While Ottawa may impose laws from time to time, the understanding seems to be that the Premiers will be mostly the decision makers. While it’s understandable to get angry at Trudeau, he’s far from the only deserving target.

Additionally, there are talks underway to launch a Municipal Nominee Program, which will allow cities to directly bring people in, and to sponsor their bids to become permanent residents. It’s unclear at this point how large it will ultimately be.

4. Key Highlights From The Year 2021

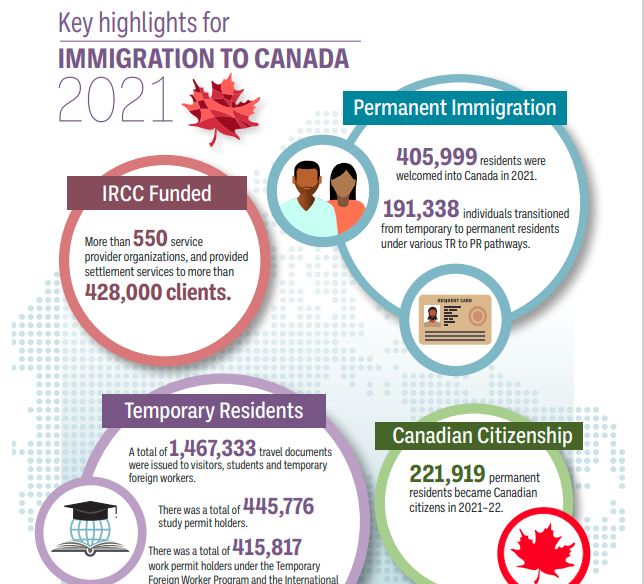
AS stated before, it’s not entirely clear how many people are staying after some kind of temporary visa, v.s. how many leave. We also don’t have hard data on the “inadmissibles” who don’t leave, and on the visitors who overstay. Consequently, take this as a rough estimate:

405,999 new permanent residents
-191,338 temps transitioning to PR
= 214,661 new permanent residents brought into Canada

Temporaries Brought Into Canada
445,776 (Student Visas Issued)
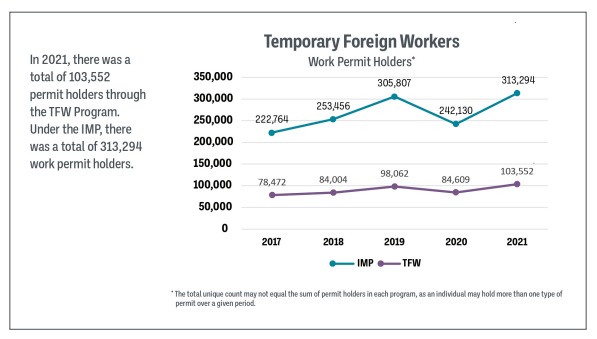
+103,552 (Temporary Foreign Worker Program)
+313,294 (International Mobility Program)
= 862,622 (in the temporary classes)

6,687 “inadmissibles” allowed under Rule 24(1) of IRPA
95 “inadmissibles” allowed under Rule 25.2(1) of IRPA

813,306 eTAs (electronic travel authorizations)
+654,027 TRV (temporary resident visas)
1,467,333 combined eTAs and TRV

221,919 permanent residents became citizens in 2021. That’s interesting, considering it’s far lower than the number of people who got their PR. Perhaps the population of Canada is much larger than we think, with a huge number who remain as PR, and don’t officially become citizens.

How many people remained in Canada? Who knows?

Other immigration (PR pathway) plans to take note of:

  • 2 pathways for Hong Kong residents (June 1, 2021 to August 31, 2026)
  • PR for TRP holders and their families (May 6, 2021 to November 5, 2021)
  • Families of air crashes PS 752 and EA302 can get PR
  • 500 people (+families) amnesty for illegals to work in construction
  • “Refugees” willing to work in health care settings can get PR

The Government brags about expediting work permits for “essential workers”, even as Canada experienced record high unemployment. They even created a program for “refugees” to get accelerated permanent residence if they work in health care settings. This comes at a time when Canadian workers are being let go for refusing the experimental shots.

Foreign students (under a rule change) became exempt from the 20 hour/week work limit that their visas typically imposed. Supposedly, this was to enable them to provide essential services. Again, this seems screwed up given how many Canadians were forced out of work.

Foreign students also received emergency benefits designed for Canadians, although the full extent of this is not yet published.

In January 2020, the G.T.A./IIRC started their program to give out permanent residencies to 500 people — and their families — who had overstayed their initial visas. This could be interpreted as an amnesty-for-illegals program, and we’ll have to see how much it expands.

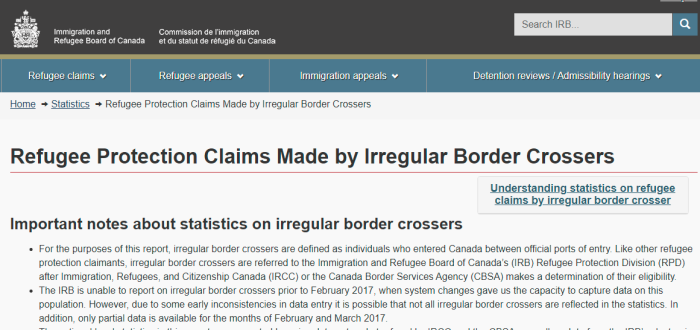
IIRC also extended the Interim Federal Health Program, or IFHP, which is a plan that also covers so-called asylum claimants. This applies also to people who’ve illegally entered from the United States. Some 14% of claimants in 2020 had entered the country illegally, primarily via Roxham Road.

There’s also an initiative underway to bring in large numbers of people from Hong Kong, who claim to be fleeing persecution. Interesting, as Canada doesn’t seem to be run much better these days.

The Rainbow Refugee Assistance Program is supposed to grow. This is to resettle people alleging they are persecuted because of their questionable behaviours.

Canada also will allow people (women primarily) fleeing domestic violence to get a temporary permit, with a the possibility of becoming a permanent resident. There isn’t any information given about whether the abuser will be deported.

New initiatives have been announced to fast-track Afghans, Ukranians and Iranians into Canada. Expect details (and numbers) in the next annual report.

There is, of course, the usual GBA+ nonsense in the document.

5. Continued Population Replacement

(Page 18 of the 2004 Annual Report to Parliament)

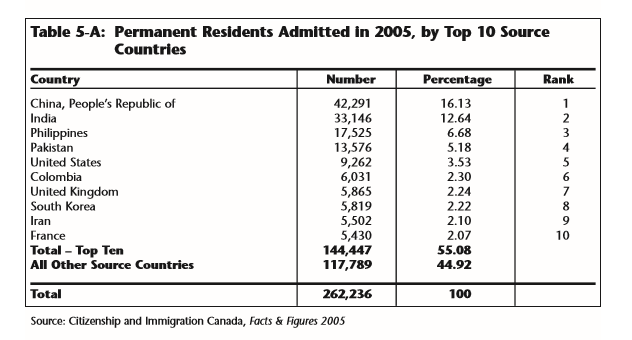
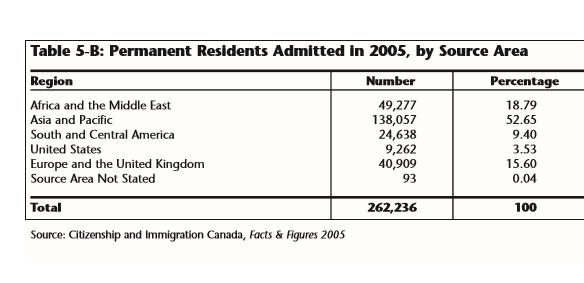
(Page 24 of the 2005 Annual Report to Parliament)

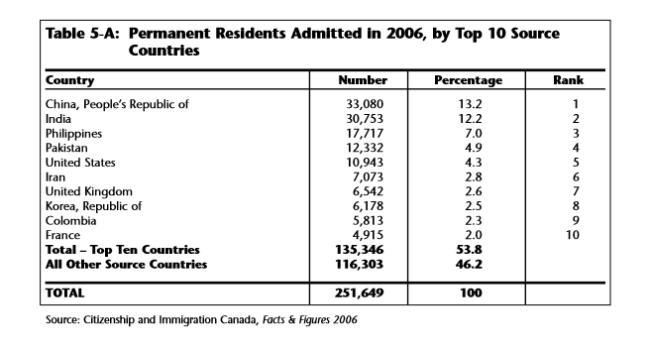
(Page 18, 19 of the 2006 Annual Report to Parliament)

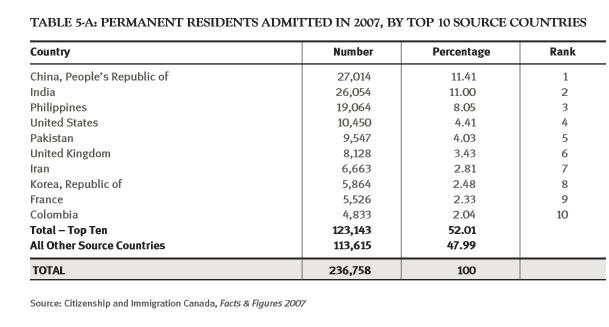
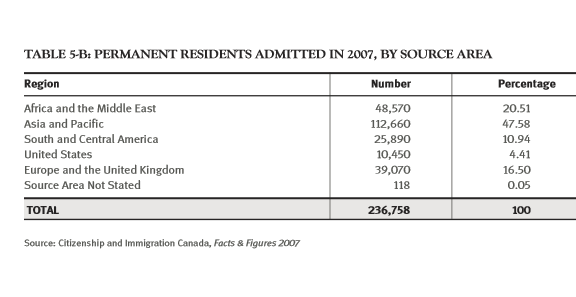
(Page 19, 20 of the 2007 Annual Report to Parliament)

(Page 21, 22 of the 2008 Annual Report to Parliament)

(Page 16 of the 2009 Annual Report to Parliament)

(Page 14 of the 2010 Annual Report to Parliament)

(Page 18 of the 2011 Annual Report to Parliament)

(Page 15 of the 2012 Annual Report to Parliament)

(Page 19 of the 2013 Annual Report to Parliament)

(Page 16 of the 2014 Annual Report to Parliament)

(Page 16 of the 2015 Annual Report to Parliament)

(Page 10 of the 2016 Annual Report to Parliament)

(Page 14 of the 2017 Annual Report to Parliament)

(Page 28 of the 2018 Annual Report to Parliament)

(Page 36 of the 2019 Annual Report to Parliament)

(Page 33 of the 2020 Annual Report to Parliament)

(Page 36 of the 2021 Annual Report to Parliament)

(Page 50 of the 2022 Annual Report to Parliament)

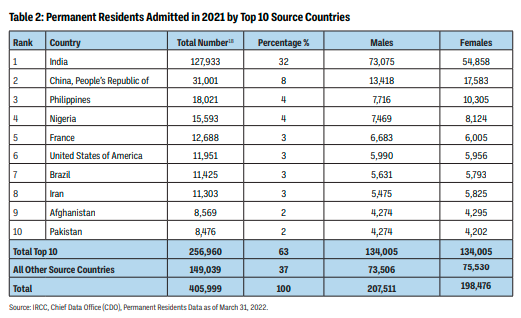
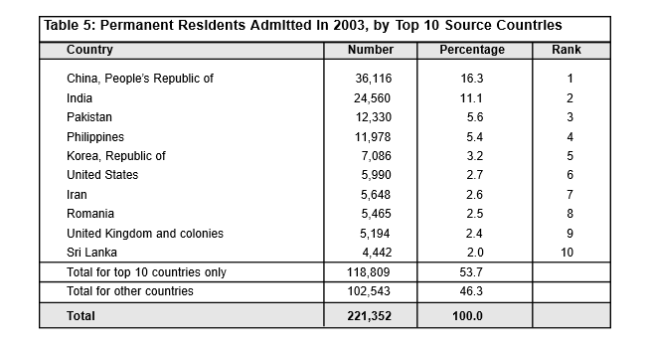
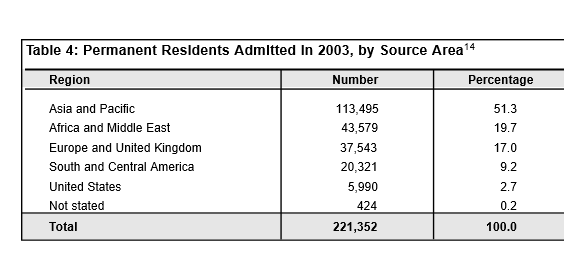
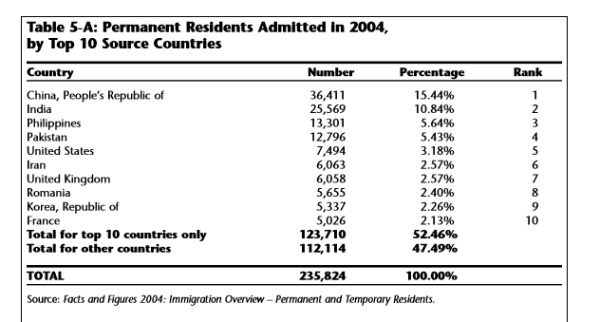
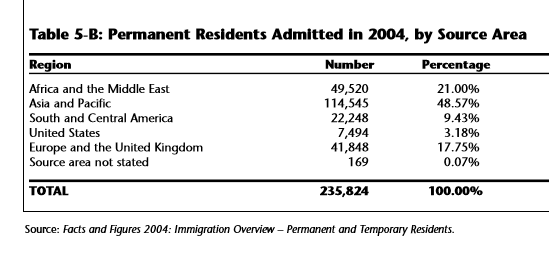
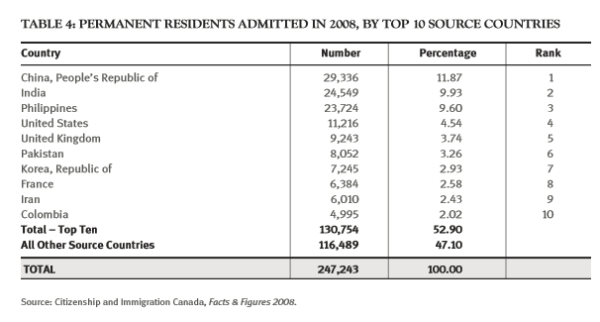
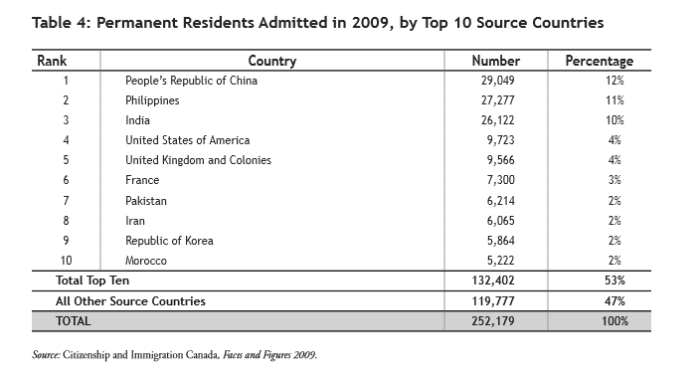
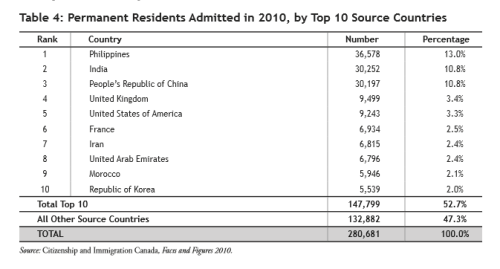
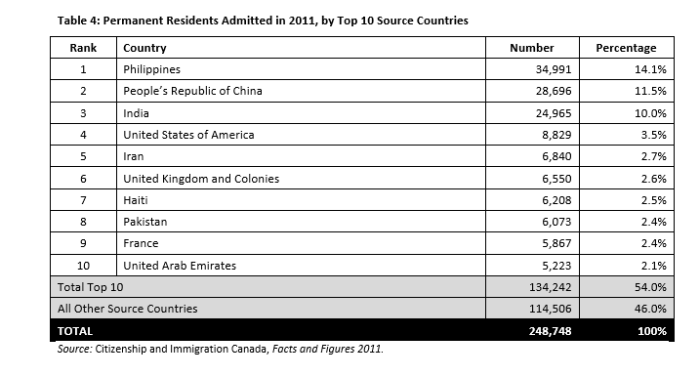
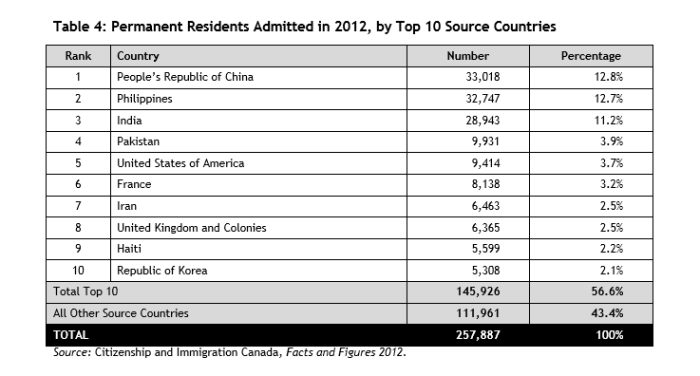
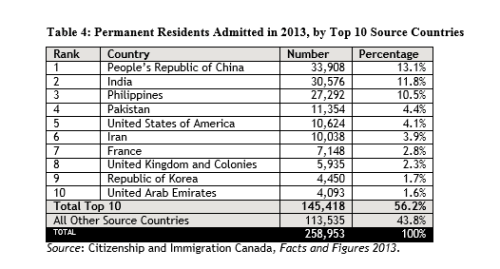
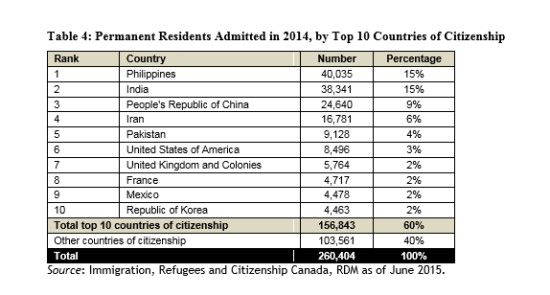
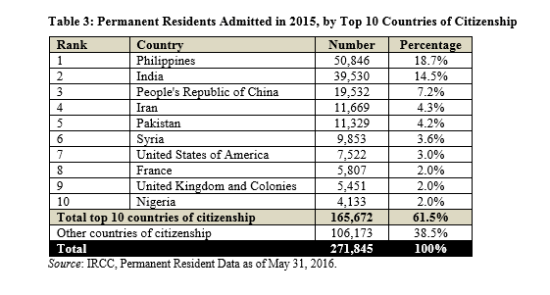
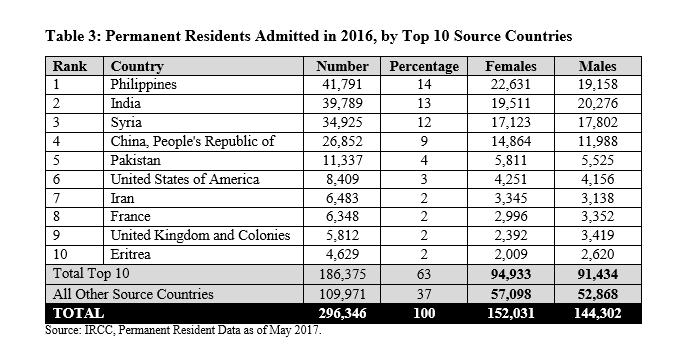
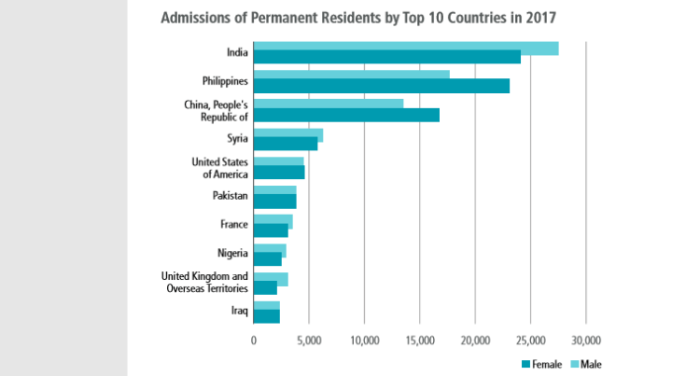
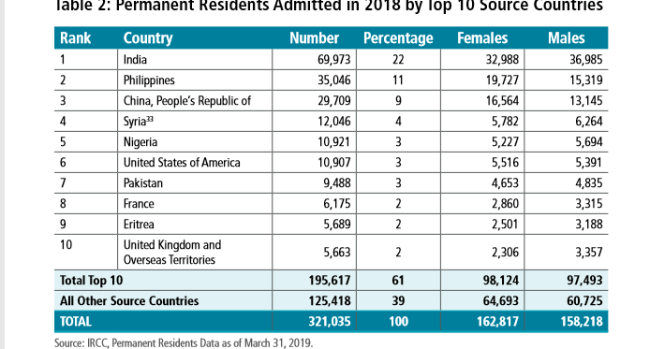
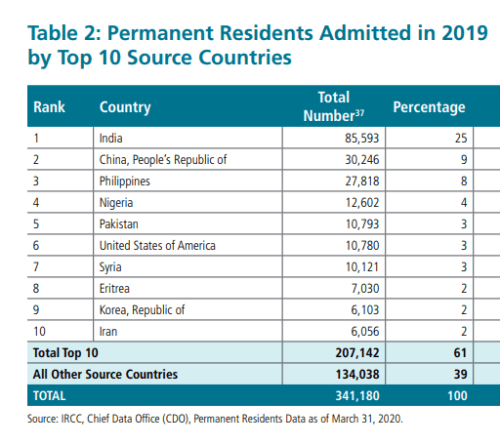
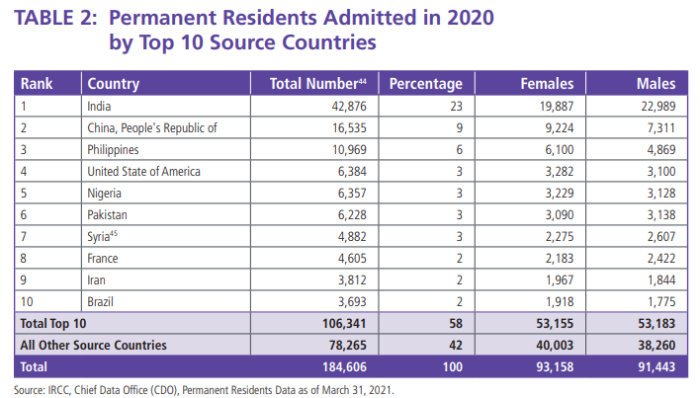
Ever get the sense that people are European descent are being replaced? It’s no coincidence. The plan for decades has been to bring in large numbers of people from the 3rd World (mostly Asia and Africa), to remake society.

As usual, the top 3 are: (a) India; (b) China; and (c) The Philippines. No surprise that the enclaves in Canada are growing. More data from the recent census will be released later this year, and the results shouldn’t be a shock to anyone. India itself comprises nearly 1/3 of the total.

And keep in mind, these are just official statistics for Permanent Residents. This is by no means everyone who is coming into the country.

6. Temporary Visitors To Canada

TRV = Temporary Resident Visa
eTA = Electronic Travel Authorization

YEAR TRV Issued eTA Issued Totals
2016 1,347,898 2,605,077 3,952,975
2017 1,617,222 4,109,918 5,570,197
2018 1,898,324 4,125,909 6,024,233
2019 1,696,871 4,077,471 5,774,342
2020 257,330 648,789 906,119
2021 654,027 813,306 1,467,333

813,306 eTAs (electronic Travel Authorizations)
654,027 TRV (Temporary Resident Visa)

Travelers entering Canada increased by 62%, compared to 2020, according to the Government’s data. Expect the numbers in 2022 to come pretty close to 2018/2019 levels.

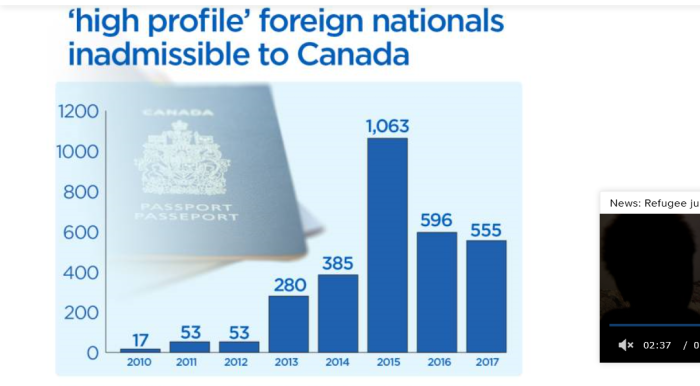
7. More “Inadmissibles” Let Into Canada

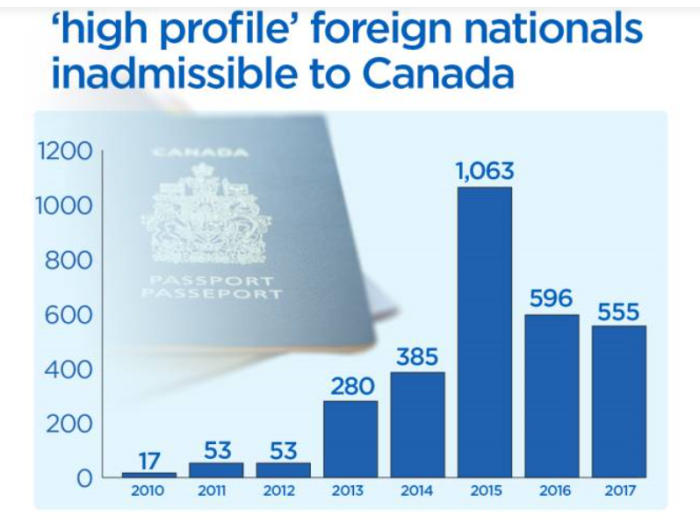
Broadly speaking, there are two provisions within IRPA, the Immigrant and Refugee Protection Act, that allow people who were previously deemed inadmissible to Canada to be given Temporary Resident Permits anyway. Here are the totals from the Annual Reports to Parliament on Immigration. Note: the first one listed only started in 2010.

Those allowed in under Rule 25.1(2) of IRPA

YEAR TRP Issued Cumulative
2010 17 17
2011 53 70
2012 53 123
2013 280 403
2014 385 788
2015 1,063 1,851
2016 596 2,447
2017 555 3002
2018 669 3,671
2019 527 4,198
2020 115 4,313
2021 95 4,408

From 2010 to 2021, a total of 4,408 people who were otherwise inadmissible to Canada were allowed in anyway under Rule 25.1(2) of IRPA. This is the category that Global News previously reported on. As for the other one, under Rule 24(1) of IRPA, Global News leaves that out:

Year Permits Cumulative
2002 12,630 12,630
2003 12,069 24,699
2004 13,598 38,297
2005 13,970 52,267
2006 13,412 65,679
2007 13,244 78,923
2008 12,821 91,744
2009 15,640 107,384
2010 12,452 119,836
2011 11,526 131,362
2012 13,564 144,926
2013 13,115 158,041
2014 10,624 168,665
2015 10,333 178,998
2016 10,568 189,566
2017 9,221 198,787
2018 7,132 205,919
2019 6,080 211,999
2020 2,044 214,043
2021 6,687 220,730

From 2002 to 2020 (inclusive), a total of 220,730 people previously deemed inadmissible to Canada were given Temporary Resident Permits anyway. This has almost certainly been going on for a lot longer, but is as far back as the reports go. Now let’s consider the reasons these people are initially refused entry.

SEC = Security (espionage, subversion, terrorism)
HRV = Human or International Rights Violations
CRIM = Criminal
S.CRIM = Serious Criminal
NC = Non Compliance
MR = Misrepresentation

YEAR Total SEC HRV Crim S.Crim NC MR
2002 12,630 ? ? ? ? ? ?
2003 12,069 17 25 5,530 869 4,855 39
2004 13,598 12 12 7,096 953 4,981 20
2005 13,970 27 15 7,917 981 4,635 21
2006 13,412 29 20 7,421 982 4,387 18
2007 13,244 25 8 7,539 977 4,109 14
2008 12,821 73 18 7,108 898 4,170 17
2009 15,640 32 23 6,619 880 7,512 10
2010 12,452 86 24 6,451 907 4,423 36
2011 11,526 37 14 6,227 899 3,932 11
2012 13,564 20 15 7,014 888 5,206 18
2013 13,115 17 10 6,816 843 5,135 8
2014 10,624 12 2 5,807 716 3,895 14
2015 10,333 3 3 5,305 578 4,315 28
2016 10,568 8 4 4,509 534 2,788 20
2017 9,221 10 5 5,035 591 3,412 121
2018 7,132 5 3 4,132 559 2,299 131
2019 6,080 2 0 3,202 546 2,139 175
2020 2,044 2 1 666 131 1,000 37
2021 6,687 1 2 602 134 1,552 48

In 2021, there 6,687 people barred were allowed in under Rule 24(1) of IRPA. That is triple what it was in 2020. Nevertheless, none of these people should be coming in.

Interestingly, even though the Government has wide discretion to let people into the country under 24(1) and 25.1(2) of IRPA, it chose not to use its discretion to prohibit anyone from entering.

Even if people are excluded from Canada — for a variety of valid reasons — often they will still be given temporary entrance into Canada. Will they ever leave? Who knows?

8. Students & Temporary Workers

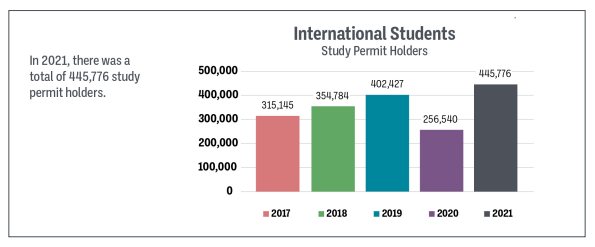
After a steep decline in 2020, the number of student visas being issued has shot back up in 2021. Expect this to get worse in the coming years.

As for the “temporary” workers, the image here seems to imply that these are the total numbers of people with permits. However, it elsewhere states that these are the number issued in 2021. Of course, the International Mobility Visas (a.k.a. “working holiday”) are only 1-2 years in length.

Year Stu TFWP IMP Total
2003 61,293 82,151 143,444

2004 56,536 90,668 147,204

2005 57,476 99,146 156,622

2006 61,703 112,658 174,361

2007 64,636 165,198 229,834

2008 79,509 192,519 272,028

2009 85,140 178,478 263,618

2010 96,157 182,276 278,433

2011 98,383 190,842 289,225

2012 104,810 213,573 318,383

2013 111,865 221,310 333,175

2014 127,698 95,086 197,924 420,078

2015 219,143 73,016 175,967 468,126

2016 265,111 78,402 207,829 551,342

2017 317,328 78,788 224,033 620,149

2018 356,876 84,229 255,034 696,139

2019 402,427 98,310 306,797 807,534

2020 256,740 84,609 242,130 583,452

2021 445,776 103,552 313,294 862,622

Stu = Student Visa
TFWP = Temporary Foreign Worker Program
IMP = International Mobility Program

Even during a “global pandemic” there were still 862,452 international student and temporary worker visas issued. This does represent an increase of about 48% from the 583,452 that came in 2020. Still, this is a staggering large number. As long as they were willing to take the shots, it seems anyone is welcome.

There are, of course, a number of pathways to remain in Canada longer and/or transition in permanent residence. Let’s not pretend that they’re all leaving afterwards. In fact, recent changes have allowed students to remain in their home countries while collecting time towards a PR designation here.

It would be nice to have more of a breakdown on the number of people who use more than 1 type of visa, but it doesn’t seem to be included here.

9. Refugee And Asylum Programs In Canada

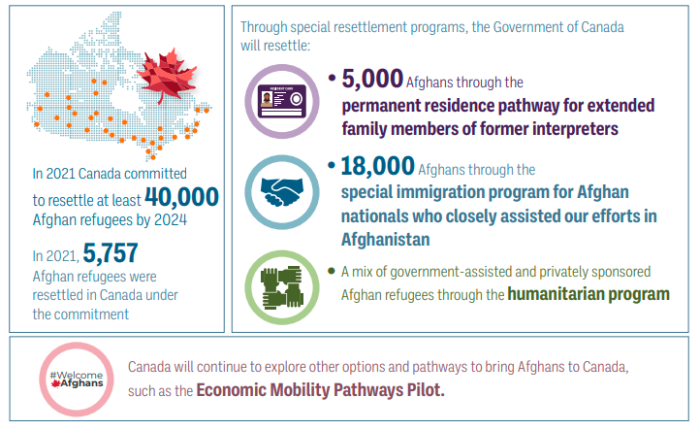
The report claims to have resettled some 20,428 refugees in 2021. There isn’t a full breakdown. As far as the top 5 source countries, they are listed as:

(a) Afghanistan (6,105)
(b) Syria (4,195)
(c) Eritrea (3,674)
(d) Iraq (1,520)
(e) Democratic Republic of Somalia (1,297)

Expect far more Afghans, Ukranians and Iranians in the next few years.

10. “Anti-Racism” Initiatives To Be Advanced In Canada

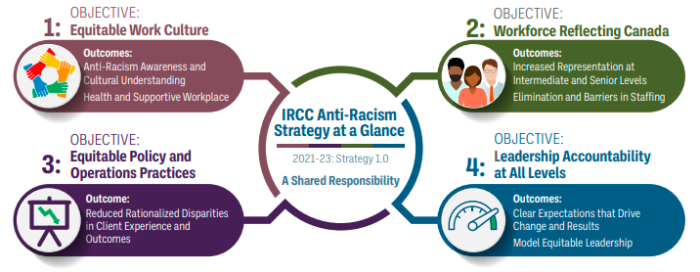
The agenda endorsed by the Federal Government is to be implemented into immigration policy as well. It’s quite openly anti-white, and gaslights objections as racism and oppressions.

  • That racism against Indigenous Peoples, Black people and racialized groups has persisted over time; it exists to support, reinforce and build upon supremacy of one group over many. In our society, this is the elevation of (the) white people (or settler groups) above everyone else in many areas of Canadian life. The inertia continues to be upheld by access, privilege and indifference.
  • That colonialism, through our immigration system, has had an impact on Indigenous Peoples.
  • That global events, such as the impact of the COVID-19 pandemic on Asian communities, fuel the rise of hate crimes in Canada. This has a profound effect on the safety and mental health of our racialized clients and employees.
  • That the experiences of many Indigenous Peoples, Black people and racialized groups intersect with sexism, ethnocentrism, classism, homophobia, Islamophobia, anti-Semitism, xenophobia and other forms of discrimination, such as those experienced by persons with visible and non-visible disabilities. These intersections exacerbate an already difficult and in some cases precarious existence.
  • That, despite efforts and some progress made, IRCC has not yet achieved a fully diverse, equitable and inclusive workplace. Black employees remain in entry-level positions, and Indigenous employees, as well as employees from racialized groups, are not sufficiently represented at the executive level.
  • That many of our staff, as expressed in town halls, focus groups, trust circles and surveys, experience racism in the workplace, feel it impacts their career advancement and lack trust in senior management to address this.
  • That our fight against racism happens in solidarity with our fight against all forms of inequity.
  • That our renewed focus on Anti-Racism today builds on the tireless efforts of many unsung heroes who have long contributed to the fight against racism and all forms of inequity.
  • That racism spans beyond hate; it includes unconscious and unintended actions.

Interestingly, the idea of colonialism via immigration is mentioned. Of course, it’s primarily non-whites who are coming these days, which should throw the narrative for a loop.

When they speak of making workplaces more diverse and equitable, they really mean that the goal is to make them less white.

Pretty strange that people continue to come to Canada in record numbers, if this place really is the racist hellhole that’s being displayed.

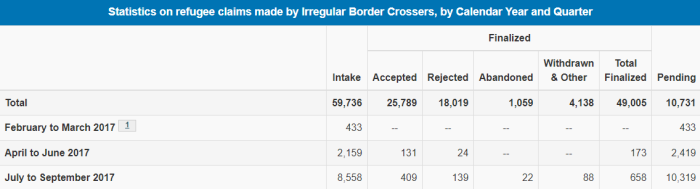
11. Illegals Entering Via U.S./Canada Border

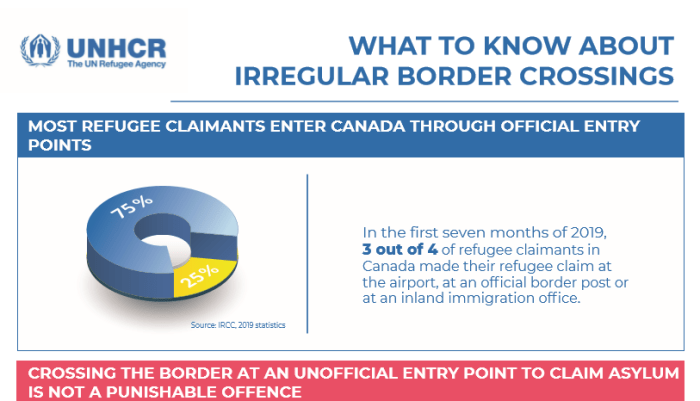
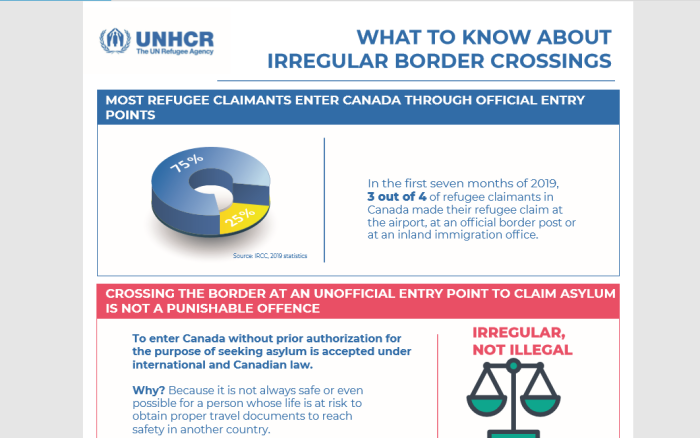
Although the report focused primarily on LEGAL immigration into Canada, the illegal brand is still worth talking about, since so few actually do. The United Nations gives detailed instructions and guidance on how to go about circumventing the border. The result, quite predictably, is that people keep trying to cross over.

YEAR: 2019
MONTH QUEBEC MANITOBA British Columbia OTHERS TOTAL
January 871 1 16 1 888
February 800 1 6 2 808
March 967 13 22 0 1,002
April 1,206 15 25 0 1,246
May 1,149 27 20 0 1,196
June 1,536 26 5 0 1,567
July 1,835 23 15 1 1,874
August 1,712 26 22 2 1,762
September 1,706 19 17 0 1,737
October 1,595 18 8 1 1,622
November 1,118 9 21 0 1,148
December 1,646 2 5 2 1,653
TOTAL 16,136 180 182 9 16,503
YEAR: 2020
MONTH QUEBEC MANITOBA British Columbia OTHERS TOTAL
January 1,086 7 7 0 1,100
February 976 2 2 0 980
March 930 7 18 0 955
April 1 0 5 0 6
May 17 0 4 0 21
June 28 1 3 1 33
July 29 2 17 0 48
August 15 3 0 0 18
September 30 4 7 0 41
October 27 0 4 0 31
November 24 0 8 0 32
December 26 2 8 0 36
TOTAL 3,189 28 84 1 3,302
YEAR: 2021
MONTH QUEBEC MANITOBA British Columbia OTHERS TOTAL
January 28 1 10 0 39
February 39 0 1 0 40
March 29 5 2 0 36
April 29 2 2 0 33
May 12 3 13 0 28
June 11 0 6 0 17
July 28 5 6 0 39
August 63 2 11 0 76
September 150 0 19 0 169
October 96 0 17 0 113
November 832 1 12 0 845
December 2,778 0 33 0 2,811
TOTAL 4,095 19 132 0 4,246

Although not listed in the Annual Immigration Report to Parliament, this is worth a mention. Illegal crossings from the U.S. did drop quite drastically in the Spring of 2020. Of course, the Government had to play along and make this “pandemic” seem real. In recent months, however, it seems the numbers are creeping back up again.

Keep in mind, the text of the Safe Third Country Agreement requires both Canada and the U.S. to consult with the UNHCR on refugees, and to get input from NGOs. We haven’t had meaningful borders in a long time.

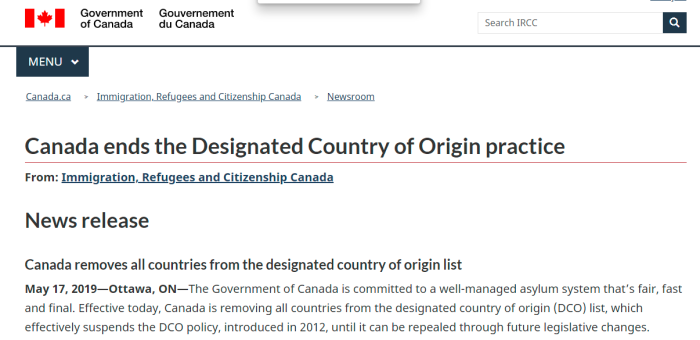
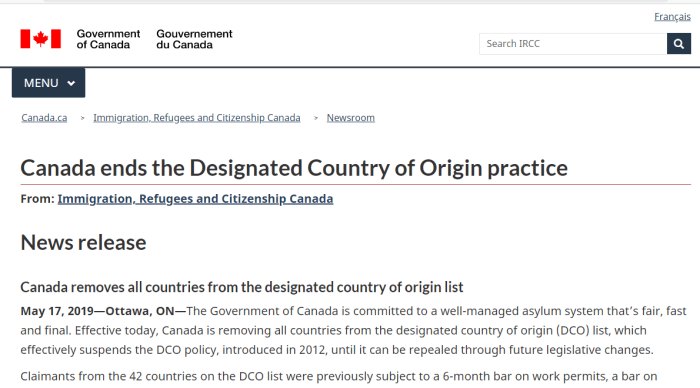
As a reminder: the Trudeau Government scrapped the DCO, or Designated Country of Origin, back in 2019. This would allow for claims from “safe” countries to be denied much more quickly. However, with things the way they are, it seems nowhere is really safe. While the issue was very mainstream from 2017 to 2019, it seems to have disappeared.

In June 2020, a new policy kicked in to finally track who is leaving the country. Even more strange that a Trudeau would bring it in when he did. Probably to make it harder for people fleeing his regime.

Overall, the replacement agenda slowed down in 2020, but it rebounded significantly in 2021. Expect it to resume in full swing for 2022 and beyond.

What Percentage Of People Entering Canada Illegally Are Allowed To Make Asylum Claims?

A question that often gets asked: What percentage of people who come into this country illegally are allowed to still make asylum claims? Just because they self-identify as refugees, it doesn’t mean that their cases will be forwarded to the I.R.B.

The quick and dirty answer: roughly 81%, or four fifths of them.

Of those making claims: some 59%, of three fifths of those, are accepted by the I.R.B.

Note: The I.R.B. page “says” 59,736 claims were started between February 2017 and September 2022. But adding them manually, it comes to 73,407. Now, these are just claims that are initiated, not necessarily the number of people granted asylum.

As should be obvious: these numbers only relate to people entering Canada illegally. This does not take into account various refugee programs that are administered. And it’s well known that this happens primarily through Roxham Road in Quebec.

This answer was calculated by contrasting data on illegals detained from Immigration and Citizenship Canada, with claims filed with the Immigration and Refugee Board of Canada.

Total illegals detained in 2017: 20,278 (starting partially through February)
Total illegals detained in 2018: 19,419
Total illegals detained in 2019: 16,503
Total illegals detained in 2020: 3,302
Total illegals detained in 2021: 4,246
Total illegals detained in 2022: 27,052 (data up until Q3, or September 2022)

Total illegals detained: 90,800 (February 2017 to September 2022)

FOR REFERENCE
Q1: January to March
Q2: April to June
Q3: July to September
Q4: October to December

This is from the various pages available here. The numbers are not exact, but a start. The Immigration and Refugee Board says that 73,407 claims by illegals were made during that time.

If these are anywhere near accurate, then 73,407/90,800 is 0.8084, or ~81%. So, approximately four fifths of the people entering Canada illegally are able to make asylum claims.

A few disclaimers need to be mentioned though.

First, if the percentages seem out of whack, there may be gaps between when people are detained by the RCMP, and when the claims are actually launched. If they are stopped at the end of a quarter, but the claim isn’t started for a few weeks, there will be discrepancies. It looks as though they were busy clearing a backlog.

If a person’s identity cannot be confirmed, or if there are security questions, it can take a very long time before a claim is filed. As such, looking at the longer range is a lot more accurate.

Still, this is a place to begin.

YEAR, QUARTER INTERCEPTIONS CLAIMS WITH IRB PERCENTAGE
2017, Feb-March 1,575 433 27.5%
2017, Q2 2,485 2,159 87.8%
2017, Q3 10,727 8,558 79.8%
2017, Q4 5,491 6,912 ?
2018, Q1 5,052 5,581 ?
2018, Q2 5,692 6,183 ?
2018, Q3 4,982 5,037 ?
2018, Q4 3,693 3,798 ?
2019, Q1 2,698 2,918 ?
2019, Q2 4,009 3,957 98.7%
2019, Q3 5,373 5,148 95.8%
2019, Q4 4,423 4,139 93.6%
2020, Q1 3,035 3,500 ?
2020, Q2 59 360 ?
2020, Q3 108 128 ?
2020, Q4 100 162 ?
2021, Q1 115 216 ?
2021, Q2 78 232 ?
2021, Q3 284 314 ?
2021, Q4 3,769 789 20.9%
2022, Q1 7,049 2,772 39.3%
2022, Q2 9,382 4,512 48.1%
2022, Q3 10,621 5,599 52.7%
Feb 2017-Sept 2022 90,800 73,407 80.8%

Note: Beginning in Q4 of 2017, and Q1 of 2018, it seems that there were more than 100% asylum applications compared to people arriving. The likely reason is that the claims weren’t started right away, making the backlog worse.

Strange, even when there were few illegals coming in 2020 and 2021, it seems that the backlog wasn’t finished off. Guess everyone stopped working.

Now, this doesn’t answer the obvious question about how many people who are declared ineligible actually leave. Either the Government doesn’t keep such data, or they don’t make it easy to find.

The CBSA reported that in 2019 and 2020, some 11,444 “removals” had taken place, but no detailed breakdown is provided. This number apparently includes failed asylum seekers, and people ordered deported for other reasons. The CBSA has also complained that the majority of the removal orders are unenforceable.

More digging will need to be done in a follow-up.

Even when this subject is covered, little in the way of hard numbers are provided. This is one of the better ones. As one point, it was reported back in 2017 that there was a backlog of some 40,000 people. It’s currently at around 17,000.

Also, the totals of 25,789 (accepted), and 18,019 (rejected) are not accurate

As for how many of them are granted asylum, doing a manual count:
February 2017 to September 2022: 29,344 claims were accepted.
February 2017 to September 2022: 20,179 claims were rejected.

Total claims ruled = 29,344 + 20,179 = 49,523.

True, this includes claims started before February 2017, but assuming the acceptance rate is pretty consistent…

If we ignore the withdrawn and abandoned claims (as is done here), then 29,344 out of 49,523 were accepted for asylum. That works out to about 59%.

If the source material is at all accurate, roughly 81% of people coming into Canada illegally are allowed to have claims heard by I.R.B., and 59% of them are accepted. If it’s not accurate, that figure could be a lot higher.

(1) https://www.irb-cisr.gc.ca/en/statistics/Pages/Irregular-border-crosser-statistics.aspx
(2) https://www.canada.ca/en/immigration-refugees-citizenship/services/refugees/asylum-claims/asylum-claims-2022.html
(3) https://www.canada.ca/en/immigration-refugees-citizenship/services/refugees/asylum-claims/asylum-claims-2021.html
(4) https://www.canada.ca/en/immigration-refugees-citizenship/services/refugees/asylum-claims/asylum-claims-2020.html
(5) https://www.canada.ca/en/immigration-refugees-citizenship/services/refugees/asylum-claims/asylum-claims-2019.html
(6) https://www.canada.ca/en/immigration-refugees-citizenship/services/refugees/asylum-claims/asylum-claims-2018.html
(7) https://www.canada.ca/en/immigration-refugees-citizenship/services/refugees/asylum-claims/asylum-claims-2017.html
(8) https://www.thestar.com/news/canada/2017/10/19/new-data-show-69-of-illegal-border-crossers-are-being-granted-asylum.html
(8) https://www.cbsa-asfc.gc.ca/security-securite/arr-det-eng.html
(9) https://www.cbsa-asfc.gc.ca/transparency-transparence/pd-dp/bbp-rpp/pacp/2020-11-24/km-mc-eng.html

At Least 9,384 Illegal Entries Into Canada In Q2 Of 2022

Things are picking up again, particularly in Quebec. The data for the second quarter of 2022 (April – June) shows that another 9,384 people illegally entered Canada, and that’s just what’s on the books. It should surprise no one that Roxham Road remains the most popular point of entry.

To make it clear, these are just the number of interceptions that happened BETWEEN official border ports. It says nothing of the system itself being otherwise gamed.

YEAR: 2022
MONTH QUEBEC MANITOBA B.C. OTHERS TOTAL
January 2,367 0 16 0 2,383
February 2,154 1 9 0 2,164
March 2,492 2 8 0 2,502
April 2,791 3 8 3 2,805
May 3,449 3 40 1 3,493
June 3,066 3 14 3 3,086
TOTALS 16,319 12 95 7 16,433

It appears that illegals coming into Canada is back in full swing, not that it ever stopped. Over 7,000 people were intercepted by the RCMP in the first 3 months of 2022. Another 9,400 came in the next 3 months. Of course, this is just what’s on the books, and just what’s publicly available.

The police didn’t seem to have any issues with shutting down businesses, stopping peaceful protests, enforcing mask orders, and the like. However, maintaining borders is something they lack the willpower to do. But they do make good bellhops.

Of course, this problem has been going on for a very long time. Here are some earlier years, to show the trends. There was a significant drop (although not a complete stop) during this “pandemic” psy-op. Makes sense, as flaunting the open borders would have been too obvious.

Let’s not pretend that this is an unsolvable problem. Governments could put a stop to mass illegal entries very quickly, if that was their goal. But they don’t, regardless of what party is in power.

PROVINCE/TERRITORY 2011 2012 2013 2014 2015 2016
Newfoundland 0 0 0 0 0 0
Prince Edward Island 0 0 0 0 0 0
Nova Scotia 0 0 0 0 0 0
New Brunswick 10 5 5 ? ? 25
Quebec 1,335 1,295 785 875 1,035 2,595
Ontario 2,660 2,340 1,995 2,630 2,790 3,7935
Manitoba 20 15 25 10 225 505
Saskatchewan ? ? ? ? ? 30
Alberta 35 40 35 65 70 120
British Columbia 125 85 110 130 170 220
Yukon 0 0 0 0 0 5
Northwest Territories 0 0 0 0 0 0
Nunavut 0 0 0 0 0 0
TOTALS 4,185 3,770 2,955 3,715 4,290 7,365

Illegals were still coming into Canada via land border crossings during the Harper years. However, it’s only considered an issue when liberals is in power. A cynic may wonder if this is done in order to help perpetuate the myth that conservatives take this seriously.

YEAR: 2017
MONTH QUEBEC MANITOBA B.C. OTHERS TOTAL
January 245 19 46 5 315
February 452 142 84 0 678
March 654 170 71 2 897
April 672 146 32 9 859
May 576 106 60 0 742
June 781 63 39 1 884
July 2,996 87 51 0 3,314
August 5,530 80 102 0 5,712
September 1,720 78 79 4 1,881
October 1,755 67 68 8 1,890
November 1,539 38 46 0 1,623
December 1,916 22 40 0 1,978
TOTAL 18,836 1,018 718 22 20,593
YEAR: 2018
MONTH QUEBEC MANITOBA B.C. OTHERS TOTAL
January 1,458 18 41 0 1,517
February 1,486 31 48 0 1,565
March 1,884 53 33 0 1,970
April 2,479 50 31 0 2,560
May 1,775 36 53 0 1,869
June 1,179 31 53 0 1,263
July 1,552 51 31 0 1,634
August 1,666 39 39 3 1,747
September 1,485 44 68 4 1,601
October 1,334 23 37 0 1,394
November 978 23 18 0 1,019
December 1,242 11 27 0 1,280
TOTAL 18,518 410 479 7 19,419
YEAR: 2019
MONTH QUEBEC MANITOBA B.C. OTHERS TOTAL
January 871 1 16 1 888
February 800 1 6 2 808
March 967 13 22 0 1,002
April 1,206 15 25 0 1,246
May 1,149 27 20 0 1,196
June 1,536 26 5 0 1,567
July 1,835 23 15 1 1,874
August 1,712 26 22 2 1,762
September 1,706 19 17 0 1,737
October 1,595 18 8 1 1,622
November 1,118 9 21 0 1,148
December 1,646 2 5 2 1,653
TOTAL 16,136 180 182 9 16,503
YEAR: 2020
MONTH QUEBEC MANITOBA B.C. OTHERS TOTAL
January 1,086 7 7 0 1,100
February 976 2 2 0 980
March 930 7 18 0 955
April 1 0 5 0 6
May 17 0 4 0 21
June 28 1 3 1 33
July 29 2 17 0 48
August 15 3 0 0 18
September 30 4 7 0 41
October 27 0 4 0 31
November 24 0 8 0 32
December 26 2 8 0 36
TOTAL 3,189 28 84 1 3,302
YEAR: 2021
MONTH QUEBEC MANITOBA B.C. OTHERS TOTAL
January 28 1 10 0 39
February 39 0 1 0 40
March 29 5 2 0 36
April 29 2 2 0 33
May 12 3 13 0 28
June 11 0 6 0 17
July 28 5 6 0 39
August 63 2 11 0 76
September 150 0 19 0 169
October 96 0 17 0 113
November 832 1 12 0 845
December 2,778 0 33 0 2,811
TOTAL 4,095 19 132 0 4,246

There are of course some other points to bring up to give additional context to the subject of illegal border crossings. These are some recent ones.

Something not really reported on in 2019 was the fact that the Canadian Government scrapped the DCO, or Designated Country of Origin policy. This stopped people from 42 countries (mainly in Europe) from being able to abuse the refugee system with bogus claims.

The Parties agree to review this Agreement and its implementation. The first review shall take place not later than 12 months from the date of entry into force and shall be jointly conducted by representatives of each Party. The Parties shall invite the UNHCR to participate in this review. The Parties shall cooperate with UNHCR in the monitoring of this Agreement and seek input from non-governmental organizations.

As for the Safe 3rd Country Agreement, people are still allowed to enter, and it’s still being gamed by human smugglers and traffickers. Few people know this, but the Treaty is actually a 3-way arrangement with the UNHCR acting as a sort of facilitator.

Not only is the United Nations a party to U.S/Canada border security, but the organization distributes information packages on how to circumvent the Safe Third Country Agreement. While claiming to care about the integrity of countries, they publish materials to do exactly the opposite.

And no, this isn’t just well meaning naivety. The U.N. has extensively studied the connection between lack of border enforcement, and the facilitation of human smuggling and trafficking. It isn’t a surprise that open borders lead to increases in illegal crossings. They know exactly what’s going on.

If that doesn’t make your blood boil, what will?

In all fairness, the issue of illegal crossings into Canada isn’t nearly as bad as the United States. Still, it’s an issue that does need to be reported on. The Q3 statistics will presumably be released in October or November of this year.

(1) https://www.cbc.ca/news/canada/montreal/roxham-road-reopen-1.6257868
(2) https://www.canada.ca/en/immigration-refugees-citizenship/services/refugees/asylum-claims/processed-claims.html
(3) https://www.canada.ca/en/immigration-refugees-citizenship/services/refugees/asylum-claims/asylum-claims-2017.html
(4) https://www.canada.ca/en/immigration-refugees-citizenship/services/refugees/asylum-claims/asylum-claims-2018.html
(5) https://www.canada.ca/en/immigration-refugees-citizenship/services/refugees/asylum-claims/asylum-claims-2019.html
(6) https://www.canada.ca/en/immigration-refugees-citizenship/services/refugees/asylum-claims/asylum-claims-2020.html
(7) https://www.canada.ca/en/immigration-refugees-citizenship/services/refugees/asylum-claims/asylum-claims-2021.html
(8) https://www.canada.ca/en/immigration-refugees-citizenship/services/refugees/asylum-claims/asylum-claims-2022.html
(9) https://www.canada.ca/en/immigration-refugees-citizenship/news/2019/05/canada-ends-the-designated-country-of-origin-practice.html
(10) https://www.canada.ca/en/immigration-refugees-citizenship/corporate/mandate/policies-operational-instructions-agreements/agreements/safe-third-country-agreement/final-text.html
(11) https://canucklaw.ca/tsce-10c-bit-of-history-doug-rob-ford-voted-in-2013-for-sanctuary-toronto-amnesty-for-illegals/

U.S. Customs And Border Protection: Some Statistics On The Invasion

This piece focuses on the problem that is the United States border, particularly the side with Mexico. There have been many interests vested in not securing it. Consequently, people flood in illegally, since there’s little reason not to.

Why should Canadians care about this?

The answer is simple: it’s not just an American problem. Open borders threatens the sovereignty of nations in general. Not only that, many of those illegal aliens will surely be working their way to Canada, given the generous welfare benefits available.

Unfortunately, far too few Canadians, including many “conservatives”, fail to realize that open borders changes everything. The makeup of the country impacts everything: voting patterns; finance; culture; crime; and future immigration policies. And the mantra “just come legally” misses the bigger picture.

For an earlier piece on the estimated real scale of illegals in the U.S., north of 22 million. There was also this gem in 2018, suing for the right to illegally enter the U.S.

Now, let’s get into some of the data from the USCBP, or the U.S. Customs and Border Patrol. The numbers are quite shocking indeed.

A note about “fiscal year”: Fiscal Year 2022 runs October 01, 2021 – September 30, 2022. All of the years seem to be done in this format.

“Recidivism” in the context of CBP refers to the percentage of people who are detained multiple times within the same fiscal year. It’s been approximately 25% the last few years, meaning 1/4 of people caught and forced to leave are caught again. There doesn’t seem to be much of a deterrent. As for drugs being brought in:

Month Marijuana Cocaine Heroin Meth Fentanyl Other
October 2021 376 220 0 290 73 3
November 2021 191 73 0 581 84 3
December 2021 127 102 66 559 26 4
January 2022 360 39 0 457 65 56
February 2022 785 90 2 268 12 27
March 2022 58 50 2 224 13 4
April 2022 259 186 14 479 174 19

Data from the 2022 fiscal year (thus far). The C.B.P. also provides recent statistics on the drug busts that have occurred from people trying to bring narcotics into the country. While it’s nice to have these seizures, it’s likely just a drop in the bucket as to what really goes on.

AGENCY INVOLVED FY17 FY18 FY19 FY20 FY21 FY22TD
Office of Field Operations Encounters 216,370 281,881 288,523 241,786 294,352 259,057
U.S. Border Patrol Total Encounters 310,531 404,142 859,501 405,036 1,662,167 1,219,920
Total Enforcement Actions 526,901 683,178 1,148,024 646,822 1,956,519 1,478,977

For “enforcement actions”, this refers to: individuals encountered at ports of entry who are seeking lawful admission into the United States but are determined to be inadmissible, individuals presenting themselves to seek humanitarian protection under our laws, and individuals who withdraw an application for admission and return to their countries of origin within a short timeframe. This is according to the CBP’s own definition.

In other words, it’s the number of people who show up LEGALLY to border ports of entry and then are turned away. It doesn’t cover the vast numbers who enter illegally between border ports.

CATEGORY FY17 FY18 FY19 FY20 FY21 FY22TD
Office Of Field Operations
Criminal Non-Citizens 10,596 11,623 12,705 7,009 6,567 9,101
NCIC Arrests 7,656 5,929 8,546 7,108 8,979 5,580
U.S. Border Patrol
Criminal Noncitizens Encountered 8,531 6,698 4,269 2,438 10,763 5,985
Criminal Noncitizens With Warrants 2,675 1,550 4,153 2,054 1,904 525

There have also been considerable amounts of arrests for people who either had criminal records, and/or outstanding warrants. This doesn’t include people who entered without being detected.

GANG ARRESTS FY15 FY16 FY17 FY18 FY19 FY20 FY21 FY22TD
18th Street 84 47 61 145 168 36 28 66
MS-13 335 253 228 413 464 72 113 149
Paisas 73 119 53 62 90 93 79 80
Other 352 283 194 188 254 162 128 98
Total 844 702 536 808 976 363 348 393

There have also been gang-related arrests of people attempting to enter the United States. Of course, not all are included, just a few which represent the larger numbers of arrests.

Concerning arrests of suspected terrorists (all nationalities), CBP provides some data of people detained at both the Southern and Northern borders.

TERRORISTS AT BORDER FY17 FY18 FY19 FY20 FY21 FY22TD
Southern Border 116 155 280 72 103 42
Northern Border 217 196 258 124 54 115
Total 333 351 538 196 157 157

How many encounters does the U.S. Government have overall? Thankfully, they do provide more data, and a lot of it is mind blowing.

Nationwide Encounters
.
Encounter data includes U.S. Border Patrol (USBP) Title 8 Apprehensions, Office of Field Operations (OFO) Title 8 Inadmissibles, and Title 42 Expulsions for fiscal years (FY) 2020, 2021, and 2022. Data is available for the Northern Land Border, Southwest Land Border, and Nationwide (i.e., air, land, and sea modes of transportation) encounters.

FISCAL YEAR 2019 2020 2021 2022
October 60,781 45,139 71,929 164,849
November 62,469 42,643 72,113 174,849
December 70,694 40,565 73,994 179,254
January 58,317 36,585 78,414 154,816
February 76,545 36,687 101,099 165,900
March 103,731 34,460 173,277 221,144
April 109,415 17,106 178,795 234,088
May 114,116 23,237 180,597
June 104,311 33,049 189,034
July 81,777 40,929 213,593
August 62,707 50,014 209,840
September 57,674 192,001 227,547
TOTAL 962,533 458,088 1,734,686 1,141,054 (so far)

Once more, how many people are simply sneaking in undetected?

The data can further be broken down by the type of person/people coming:

  • Accompanied Minors (AM)
  • Individuals in a Family Unit (FMUA)
  • Single Adults
  • Unaccompanied Children (UC)

While there are clearly a lot of people who get stopped by the various departments, an awful lot don’t. They are let in through some pathway, or just sneak in.

It also doesn’t help that there are countless Sanctuary Cities and States, which do an end run around border security. If people know they can get social services without the risk of being deported, many more will come.

Again, this is not just an American issue. Many of the hordes flooding into the U.S. will eventually make their way North. Canadians should absolutely be worried about this.

A little self promotion: Borderless Canada is still available online. Learn about what’s been going on in this country. Virtually all major issues can be directly tied to immigration and border security, and it’s not racist or bigoted to discuss these hard truths.

Don’t worry, there will be much more included on this subject in the near future. This can’t be done justice by a single piece.

(1) https://www.cbp.gov/
(2) https://www.cbp.gov/newsroom/stats/cbp-enforcement-statistics
(3) https://www.cbp.gov/newsroom/stats/nationwide-encounters
(4) https://www.cbp.gov/newsroom/stats/southwest-land-border-encounters
(5) https://canucklaw.ca/true-scale-of-illegals-in-us-22-million-more-amnesty-coming/
(6) https://canucklaw.ca/tsce-2-migrant-caravan-lawyers-sue-for-right-to-legally-invade-u-s/
(7) https://canucklaw.ca/tsce-10b-sanctuary-cities-an-end-run-around-having-borders/

Demographic Makeup Of People Entering Canada Illegally 2017-2021

Now for something that isn’t covered much by mainstream (or alternative) media. Who exactly is coming into Canada illegally, in between official border ports of entry? What are the numbers? Fortunately, the Immigration and Refugee Board has at least some information to share.

RANK COUNTRY INTAKE ACC REJ ABAN WD&O RESOLVED PENDING
n/a Total 60,544 25,802 18,010 1,059 3,404 49,000 11,544
1 Nigeria 16,374 4,739 7,279 189 1,785 13,992 2,382
2 Haiti 9,350 2,210 4,595 323 517 7,645 1,705
3 Colombia 3,565 1,629 486 57 117 2,289 1,276
4 Pakistan 2,406 1,184 670 21 115 1,990 416
5 DR Congo 2,165 479 416 36 145 1,076 1,089
6 Turkey 2,011 1,812 43 <20 <20 1,901 110
7 Sudan 1,694 1,372 123 25 77 1,597 97
8 Angola 1,486 420 381 <20 <20 865 621
9 Eritrea 1,224 1,004 <20 <20 105 1,178 46
10 U.S.A. 1,203 24 754 57 160 995 208
n/a All Others 19,066 10,929 3,205 308 305 15,472 3,594

ACC = Accepted
REJ = Rejected
ABAN = Abandoned
WD&O = Withdrawn And Other

**The IRB lists some totals as <20, and they claim that this is done for privacy reasons. The logic seems to be that if there were only a few who crossed, it would be easier to identify them.

The above totals are from February 2017 to December​​ 2021. The IRB claims that it didn’t have access to such information prior to this.

Isn’t this lovely, that the bulk of the people ILLEGALLY entering Canada are from the 3rd World? But let’s be fair, we don’t have nearly enough rocket scientists and brain surgeons here already. Keep in mind, these people have entered the United States — at some point — and decided to continue onwards. They’ve already passed on at least one safe country, one that gets hundreds of thousands of applications per year.

And again, this could be stopped very quickly. However, politicians (of all stripes) actively work against the interests of their own citizens.

(1) https://www.irb-cisr.gc.ca/en/statistics/Pages/irregular-border-crossers-countries.aspx
(2) https://archive.ph/x4T1i
(3) Wayback Machine

Illegal Aliens Coming Into Canada: 2022, And Earlier

Things are picking up again, particularly in Quebec.

YEAR: 2022
MONTH QUEBEC MANITOBA B.C. OTHERS TOTAL
January 2,367 0 16 0 2,383
February 2,154 1 9 0 2,164
March 2,492 2 8 0 2,502
TOTALS 7,013 3 33 0 7,049

It appears that illegals coming into Canada is back in full swing, not that it ever stopped. Over 7,000 people were intercepted by the RCMP in the first 3 months of 2022. Of course, this is just what’s on the books, and just what’s publicly available.

The police didn’t seem to have any issues with shutting down businesses, stopping peaceful protests, enforcing mask orders, and the like. However, enforcing borders is something they lack the willpower to do. But they do make good bellhops.

Of course, this problem has been going on for a very long time. Here are some earlier years, to show the trends. There was a significant drop (although not a complete stop) during this “pandemic” psy-op. Perhaps Government at least needs to put on appearances.

Let’s not pretend that this is an unsolvable problem. Governments could put a stop to mass illegal entries very quickly, if that was their goal. But they don’t, regardless of what party is in power.

PROVINCE/TERRITORY 2011 2012 2013 2014 2015 2016
Newfoundland 0 0 0 0 0 0
Prince Edward Island 0 0 0 0 0 0
Nova Scotia 0 0 0 0 0 0
New Brunswick 10 5 5 ? ? 25
Quebec 1,335 1,295 785 875 1,035 2,595
Ontario 2,660 2,340 1,995 2,630 2,790 3,7935
Manitoba 20 15 25 10 225 505
Saskatchewan ? ? ? ? ? 30
Alberta 35 40 35 65 70 120
British Columbia 125 85 110 130 170 220
Yukon 0 0 0 0 0 5
Northwest Territories 0 0 0 0 0 0
Nunavut 0 0 0 0 0 0
TOTALS 4,185 3,770 2,955 3,715 4,290 7,365

Illegals were still coming into Canada via land border crossings during the Harper years. However, it’s only considered an issue when Trudeau is in power.

YEAR: 2017
MONTH QUEBEC MANITOBA B.C. OTHERS TOTAL
January 245 19 46 5 315
February 452 142 84 0 678
March 654 170 71 2 897
April 672 146 32 9 859
May 576 106 60 0 742
June 781 63 39 1 884
July 2,996 87 51 0 3,314
August 5,530 80 102 0 5,712
September 1,720 78 79 4 1,881
October 1,755 67 68 8 1,890
November 1,539 38 46 0 1,623
December 1,916 22 40 0 1,978
TOTAL 18,836 1,018 718 22 20,593
YEAR: 2018
MONTH QUEBEC MANITOBA B.C. OTHERS TOTAL
January 1,458 18 41 0 1,517
February 1,486 31 48 0 1,565
March 1,884 53 33 0 1,970
April 2,479 50 31 0 2,560
May 1,775 36 53 0 1,869
June 1,179 31 53 0 1,263
July 1,552 51 31 0 1,634
August 1,666 39 39 3 1,747
September 1,485 44 68 4 1,601
October 1,334 23 37 0 1,394
November 978 23 18 0 1,019
December 1,242 11 27 0 1,280
TOTAL 18,518 410 479 7 19,419
YEAR: 2019
MONTH QUEBEC MANITOBA B.C. OTHERS TOTAL
January 871 1 16 1 888
February 800 1 6 2 808
March 967 13 22 0 1,002
April 1,206 15 25 0 1,246
May 1,149 27 20 0 1,196
June 1,536 26 5 0 1,567
July 1,835 23 15 1 1,874
August 1,712 26 22 2 1,762
September 1,706 19 17 0 1,737
October 1,595 18 8 1 1,622
November 1,118 9 21 0 1,148
December 1,646 2 5 2 1,653
TOTAL 16,136 180 182 9 16,503
YEAR: 2020
MONTH QUEBEC MANITOBA B.C. OTHERS TOTAL
January 1,086 7 7 0 1,100
February 976 2 2 0 980
March 930 7 18 0 955
April 1 0 5 0 6
May 17 0 4 0 21
June 28 1 3 1 33
July 29 2 17 0 48
August 15 3 0 0 18
September 30 4 7 0 41
October 27 0 4 0 31
November 24 0 8 0 32
December 26 2 8 0 36
TOTAL 3,189 28 84 1 3,302
YEAR: 2021
MONTH QUEBEC MANITOBA B.C. OTHERS TOTAL
January 28 1 10 0 39
February 39 0 1 0 40
March 29 5 2 0 36
April 29 2 2 0 33
May 12 3 13 0 28
June 11 0 6 0 17
July 28 5 6 0 39
August 63 2 11 0 76
September 150 0 19 0 169
October 96 0 17 0 113
November 832 1 12 0 845
December 2,778 0 33 0 2,811
TOTAL 4,095 19 132 0 4,246

One can only imagine how bad the rest of 2022 will end up being with this issue. Of course, the vast scale of LEGAL immigration is a much, MUCH bigger problem than the illegal entries. That said, it’s not an issue that can be ignored.

There are of course some other points to bring up to give additional context to the subject of illegal border crossings.

Something not really reported on in 2019 was the fact that the Canadian Government scrapped the DCO, or Designated Country of Origin policy. This stopped people from 42 countries (mainly in Europe) from being able to abuse the refugee system with bogus claims.

The Parties agree to review this Agreement and its implementation. The first review shall take place not later than 12 months from the date of entry into force and shall be jointly conducted by representatives of each Party. The Parties shall invite the UNHCR to participate in this review. The Parties shall cooperate with UNHCR in the monitoring of this Agreement and seek input from non-governmental organizations.

As for the Safe 3rd Country Agreement, people are still allowed to enter, and it’s still being gamed by human smugglers and traffickers.

Section 8 of the text makes it clear that the UNHCR, or United Nations High Commission on Refugees, is a Party to this Treaty. Interestingly, this detail is never reported by the mainstream press.

In addition to the people who ILLEGALLY enter Canada, our “authorities” LEGALLY let in thousands of people each year who had initially been denied for a variety of reasons. IRPA, the Immigration and Refugee Protection Act, has at least 2 provisions to allow inadmissible people in anyway. These are sections 24(1) and 25.1(2).

Even if previously deemed inadmissible to Canada to be given Temporary Resident Permits anyway. Here are the totals from the Annual Reports to Parliament on Immigration. Note: the first one listed only started in 2010.

Those allowed in under Rule 25.1(2) of IRPA

YEAR TRP Issued Cumulative
2010 17 17
2011 53 70
2012 53 123
2013 280 403
2014 385 788
2015 1,063 1,851
2016 596 2,447
2017 555 3002
2018 669 3,671
2019 527 4,198
2020 115 4,313

From 2010 to 2020, a total of 4,313 people who were otherwise inadmissible to Canada were allowed in anyway under Rule 25.1(2) of IRPA. This is the category that Global News previously reported on. As for the other one, under Rule 24(1) of IRPA, Global News leaves that out:

Year Permits Cumulative
2002 12,630 12,630
2003 12,069 24,699
2004 13,598 38,297
2005 13,970 52,267
2006 13,412 65,679
2007 13,244 78,923
2008 12,821 91,744
2009 15,640 107,384
2010 12,452 119,836
2011 11,526 131,362
2012 13,564 144,926
2013 13,115 158,041
2014 10,624 168,665
2015 10,333 178,998
2016 10,568 189,566
2017 9,221 198,787
2018 7,132 205,919
2019 6,080 211,999
2020 2,044 214,043

From 2002 to 2020 (inclusive), a total of 214,043 people previously deemed inadmissible to Canada were given Temporary Resident Permits anyway. This has almost certainly been going on for a lot longer, but is as far back as the reports go. Now let’s consider the reasons these people are initially refused entry.

SEC = Security (espionage, subversion, terrorism)
HRV = Human or International Rights Violations
CRIM = Criminal
S.CRIM = Serious Criminal
NC = Non Compliance
MR = Misrepresentation

YEAR Total SEC HRV Crim S.Crim NC MR
2002 12,630 ? ? ? ? ? ?
2003 12,069 17 25 5,530 869 4,855 39
2004 13,598 12 12 7,096 953 4,981 20
2005 13,970 27 15 7,917 981 4,635 21
2006 13,412 29 20 7,421 982 4,387 18
2007 13,244 25 8 7,539 977 4,109 14
2008 12,821 73 18 7,108 898 4,170 17
2009 15,640 32 23 6,619 880 7,512 10
2010 12,452 86 24 6,451 907 4,423 36
2011 11,526 37 14 6,227 899 3,932 11
2012 13,564 20 15 7,014 888 5,206 18
2013 13,115 17 10 6,816 843 5,135 8
2014 10,624 12 2 5,807 716 3,895 14
2015 10,333 3 3 5,305 578 4,315 28
2016 10,568 8 4 4,509 534 2,788 20
2017 9,221 10 5 5,035 591 3,412 121
2018 7,132 5 3 4,132 559 2,299 131
2019 6,080 2 0 3,202 546 2,139 175
2020 2,044 2 1 666 131 1,000 37

In 2020, only 2,044 people barred were allowed in under Rule 24(1) of IRPA, which is the lowest it’s been since this legislation was enacted. Nonetheless, ZERO of these people should be coming in.

Interestingly, even though the Government has wide discretion to let people into the country under 24(1) and 25.1(2) of IRPA, it chose not to use its discretion to prohibit anyone from entering.

The data for these tables was compiled from the Annual Immigration Reports to Parliament. They are included at the bottom as source material.

Even if people are excluded from Canada — for a variety of valid reasons — often they will still be given temporary entrance into Canada. Will they ever leave? Who knows?

Not only are people let in who shouldn’t be, but sanctuary cities like Toronto and Montreal provide social services (at taxpayer expense) to people here illegally. Do right wingers oppose this? Nope, many of them have facilitated this problem.

Of course, none of this addresses the elephant in the room: the genocidal levels of replacement migration that come in through various legal channels on visas.

It’s strange that so many who identify as conservatives or nationalists are silent on what’s going on. Worse, these gatekeepers condemn and mock people who speak up on these important issues. To all those constitutionalists out there: how will you maintain your systems of law when you are eventually outvoted by people who want very different things?

(1) https://www.cbc.ca/news/canada/montreal/roxham-road-reopen-1.6257868
(2) https://www.canada.ca/en/immigration-refugees-citizenship/services/refugees/asylum-claims/processed-claims.html
(3) https://www.canada.ca/en/immigration-refugees-citizenship/services/refugees/asylum-claims/asylum-claims-2017.html
(4) https://www.canada.ca/en/immigration-refugees-citizenship/services/refugees/asylum-claims/asylum-claims-2018.html
(5) https://www.canada.ca/en/immigration-refugees-citizenship/services/refugees/asylum-claims/asylum-claims-2019.html
(6) https://www.canada.ca/en/immigration-refugees-citizenship/services/refugees/asylum-claims/asylum-claims-2020.html
(7) https://www.canada.ca/en/immigration-refugees-citizenship/services/refugees/asylum-claims/asylum-claims-2021.html
(8) https://www.canada.ca/en/immigration-refugees-citizenship/services/refugees/asylum-claims/asylum-claims-2022.html
(9) https://www.canada.ca/en/immigration-refugees-citizenship/news/2019/05/canada-ends-the-designated-country-of-origin-practice.html
(10) https://www.canada.ca/en/immigration-refugees-citizenship/corporate/mandate/policies-operational-instructions-agreements/agreements/safe-third-country-agreement/final-text.html
(11) https://canucklaw.ca/tsce-10c-bit-of-history-doug-rob-ford-voted-in-2013-for-sanctuary-toronto-amnesty-for-illegals/

ANNUAL IMMIGRATION REPORTS TO PARLIAMENT
2004.annual.immigration.report.to.parliament
2005.annual.immigration.report.to.parliament
2006.annual.immigration.report.to.parliament
2007.annual.immigration.report.to.parliament
2008.annual.immigration.report.to.parliament
2009.annual.immigration.report.to.parliament
2010.annual.immigration.report.to.parliament
2011.annual.immigration.report.to.parliament
2012.annual.immigration.report.to.parliament
2013.annual.immigration.report.to.parliament
2014.annual.immigration.report.to.parliament
2015.annual.immigration.report.to.parliament
2016.annual.immigration.report.to.parliament
2017.annual.immigration.report.to.parliament
2018.annual.immigration.report.to.parliament
2019.annual.immigration.report.to.parliament
2020.annual.immigration.report.to.parliament
2021.annual.immigration.report.to.parliament